Figure
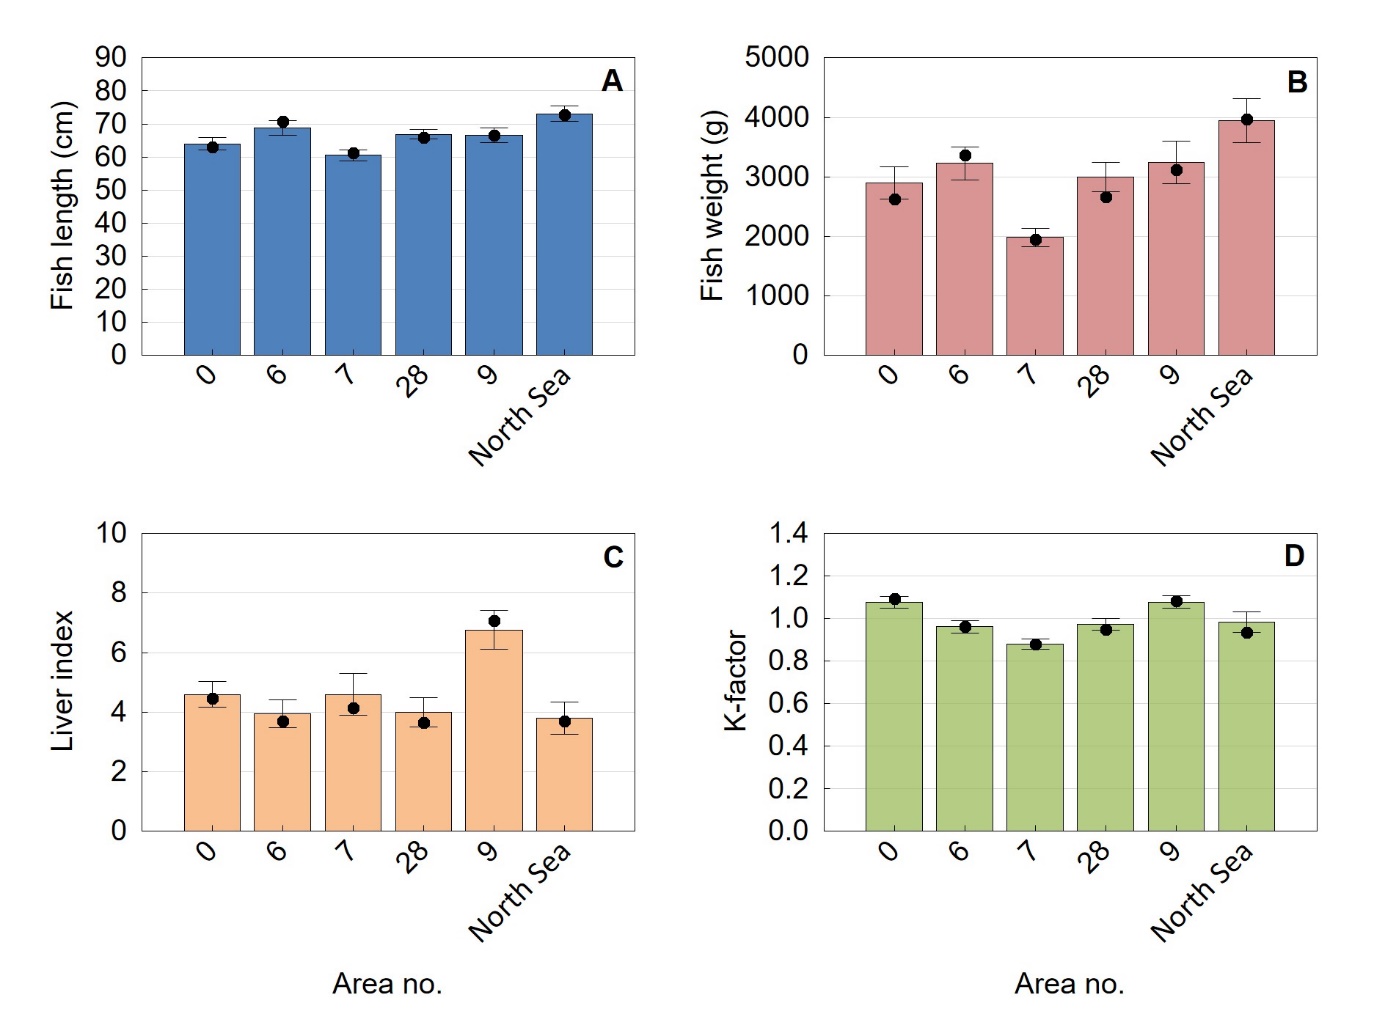
31 A) Fish length (cm), B) weight (g), and
C) k-factor (K = 100 x weight/length 3 )
an D) liver index (100 x Liver weight/fish weight) of pollack
( Pollachius
pollachius ) sampled in different
areas (statistics areas) of the Norwegian coast (from north to south;
area 00 to 09) and in the North Sea. Mean ± 95% confidence intervals
are given, as well as median values (black dots).