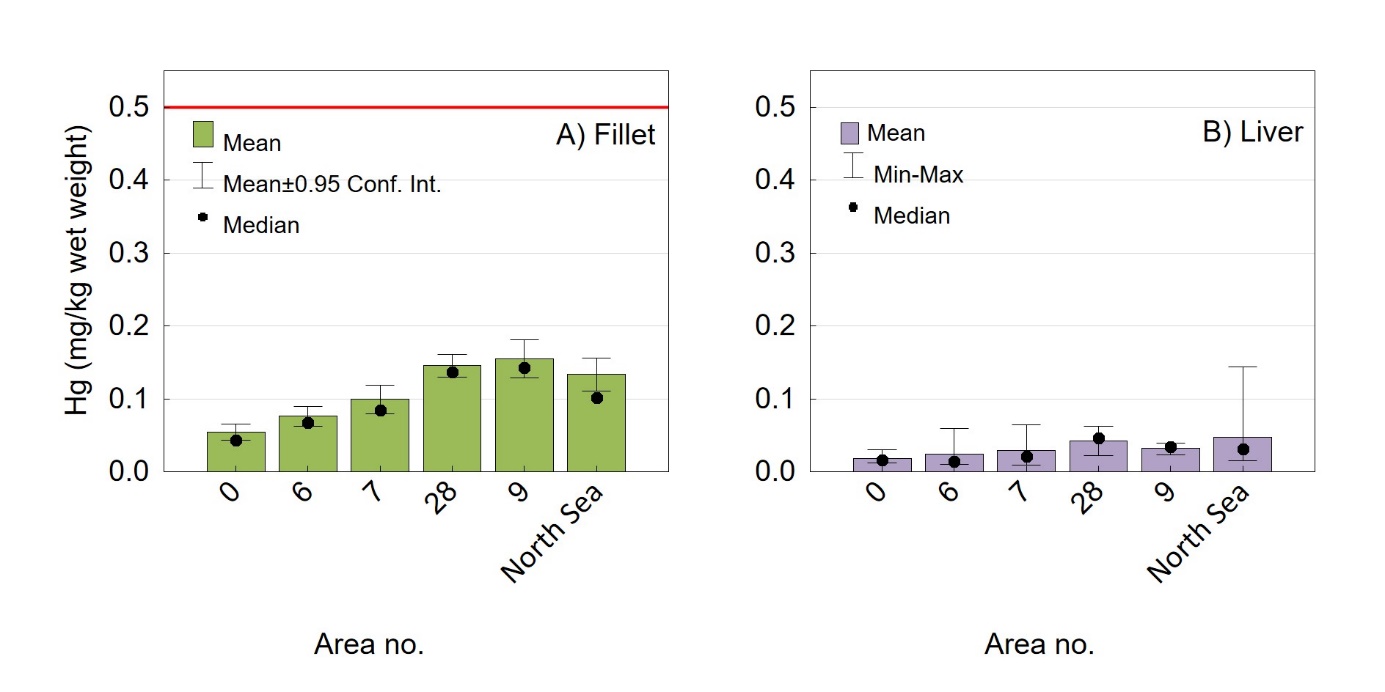
Figure
35 Variation in Hg concentration (mg/kg wet
weight) in A) individual fillet samples and B) composite liver
samples of pollack ( Pollachius
pollachius ) sampled in different
areas along the Norwegian coast (from north to south; area 00 to 09)
and in the North Sea during 2016-2019. For fillet, mean ± 95%
confidence interval and median values (black dots) are given. For
liver, mean, minimum, maximum and median values (black dots) are
shown. The red line indicates the maximum level for Hg in fish for
human consumption, not applying to liver.