Figure
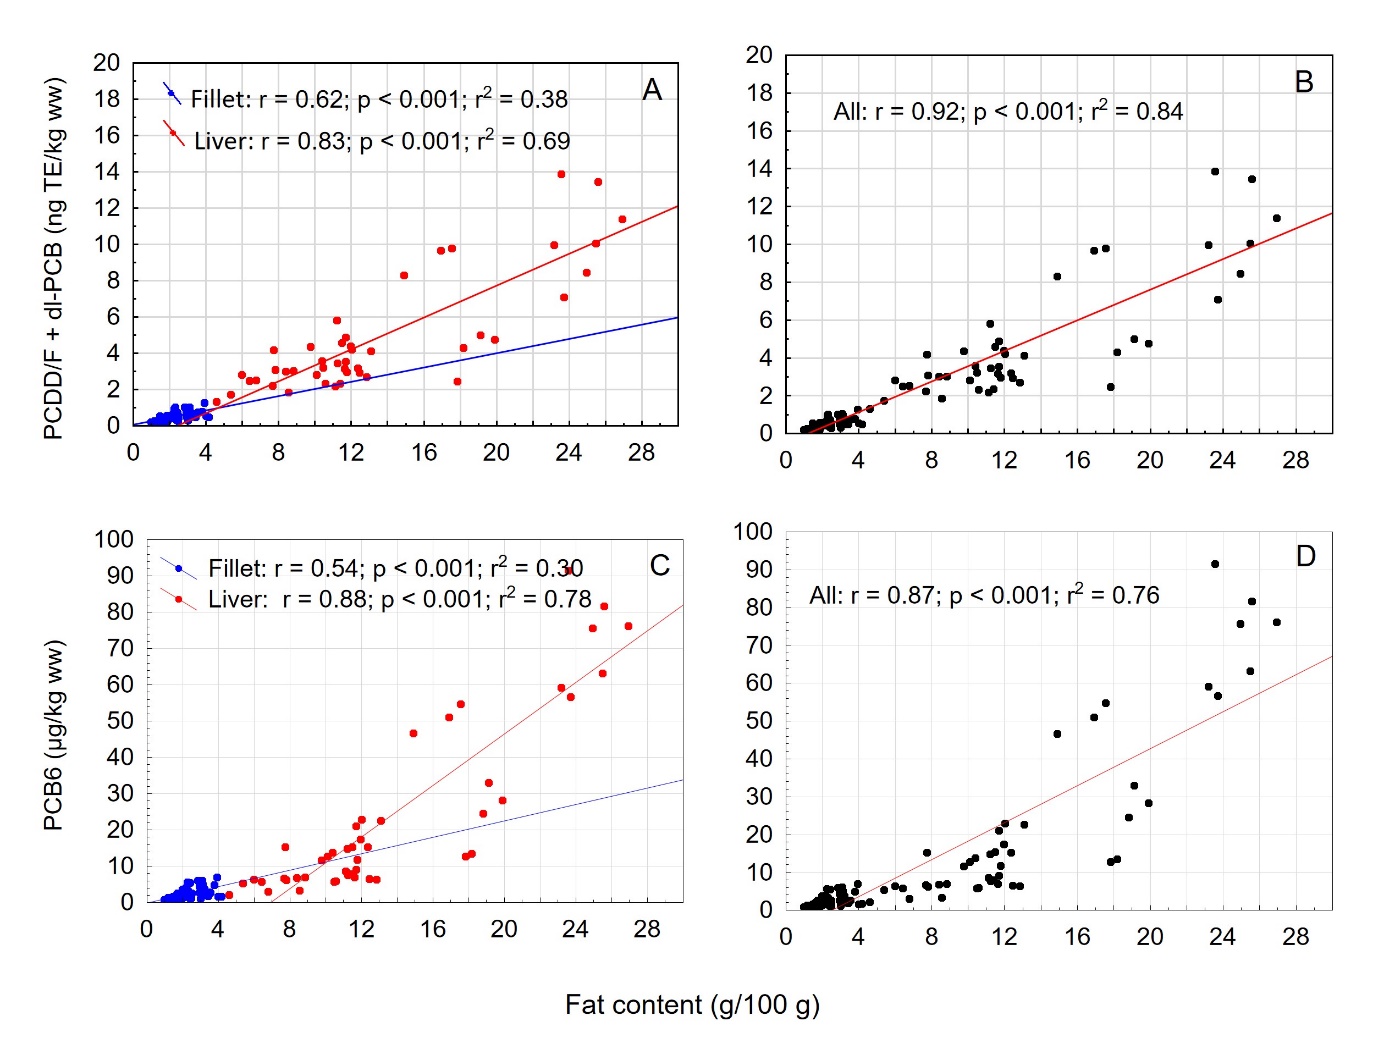
14 . Dioxins and dioxin-like PCBs and PCB6
in plaice ( Pleuronectes
platessa ). Correlation between
fat content (g/100 g) and concentration of A, B) sum dioxins and
dioxin-like PCBs (PCDD/F + dl-PCB, ng TEQ/kg wet weight, ww) and C,
D) sum PCB6 (µg/kg ww). Correlations are given for A, C) fillet and
liver separately and B, D) all fillet and liver samples combined.
Results of Pearson’s linear correlation are given. One liver sample
(outlier) with very high concentration of PCDD/F + dl-PCB was
excluded from the graph and analysis.