Figure
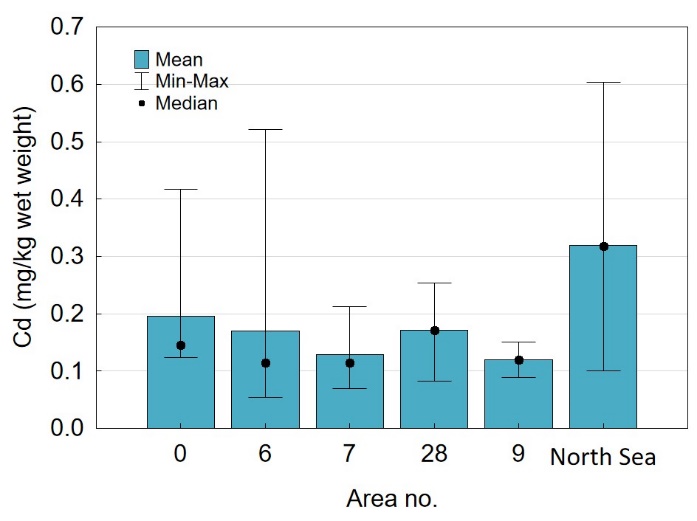
34 Cd in composite liver samples of pollack
( Pollachius
pollachius ) from different areas
along the Norwegian coast (from north to south; area 00 to 09) and in
the North Sea. Results are given as mean (bars), median (black dots),
minimum and maximum values (error bars).