Gå til hovedinnhold
Havforskningsinstituttet
HI
English
<- Tilbake
Søk
Søk
Søk
View page in English
Figur
Fra rapporten:
Monitoring bycatches in Norwegian fisheries
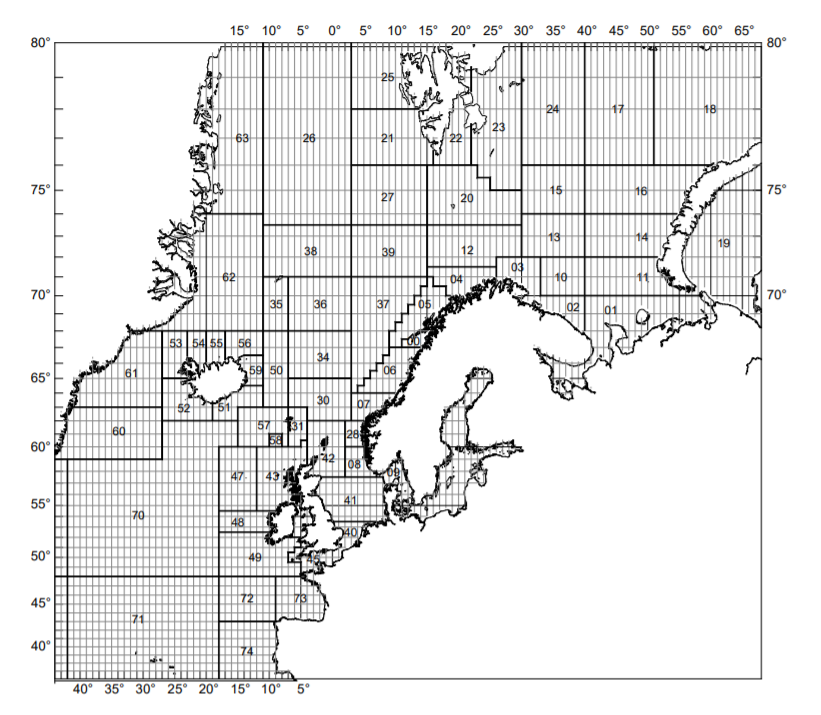
Figure A1. Map of statistical areas defined by the Norwegian Directorate of Fisheries