Gå til hovedinnhold
Havforskningsinstituttet
HI
English
<- Tilbake
Søk
Søk
Søk
View page in English
Figur
Fra rapporten:
Fremmedstoffer i snabeluer (Sebastes mentella) og vanlig uer (Sebastes norvegicus)
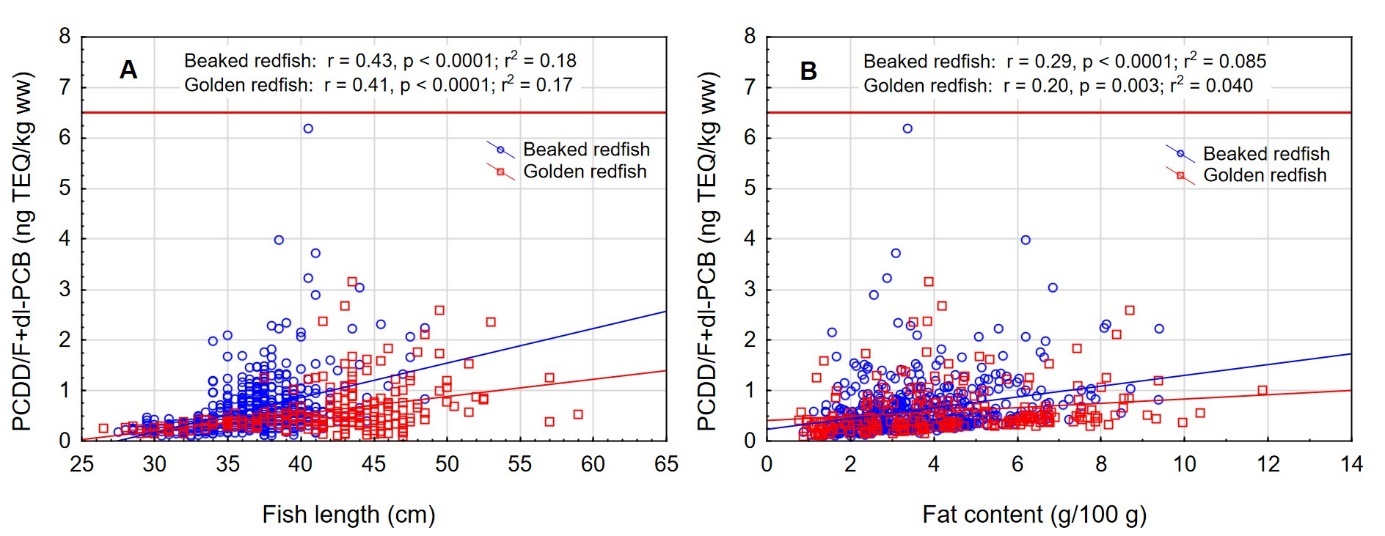
Figure 13. Correlation between A) fish length (cm) and B) fat content (g/100g) and concentration of sum PCDD/F+dl-PCB (ng TEQ/kg wet weight) in fillet from beaked redfish and golden redfish. Results of Pearson’s linear correlation are given.