Figure
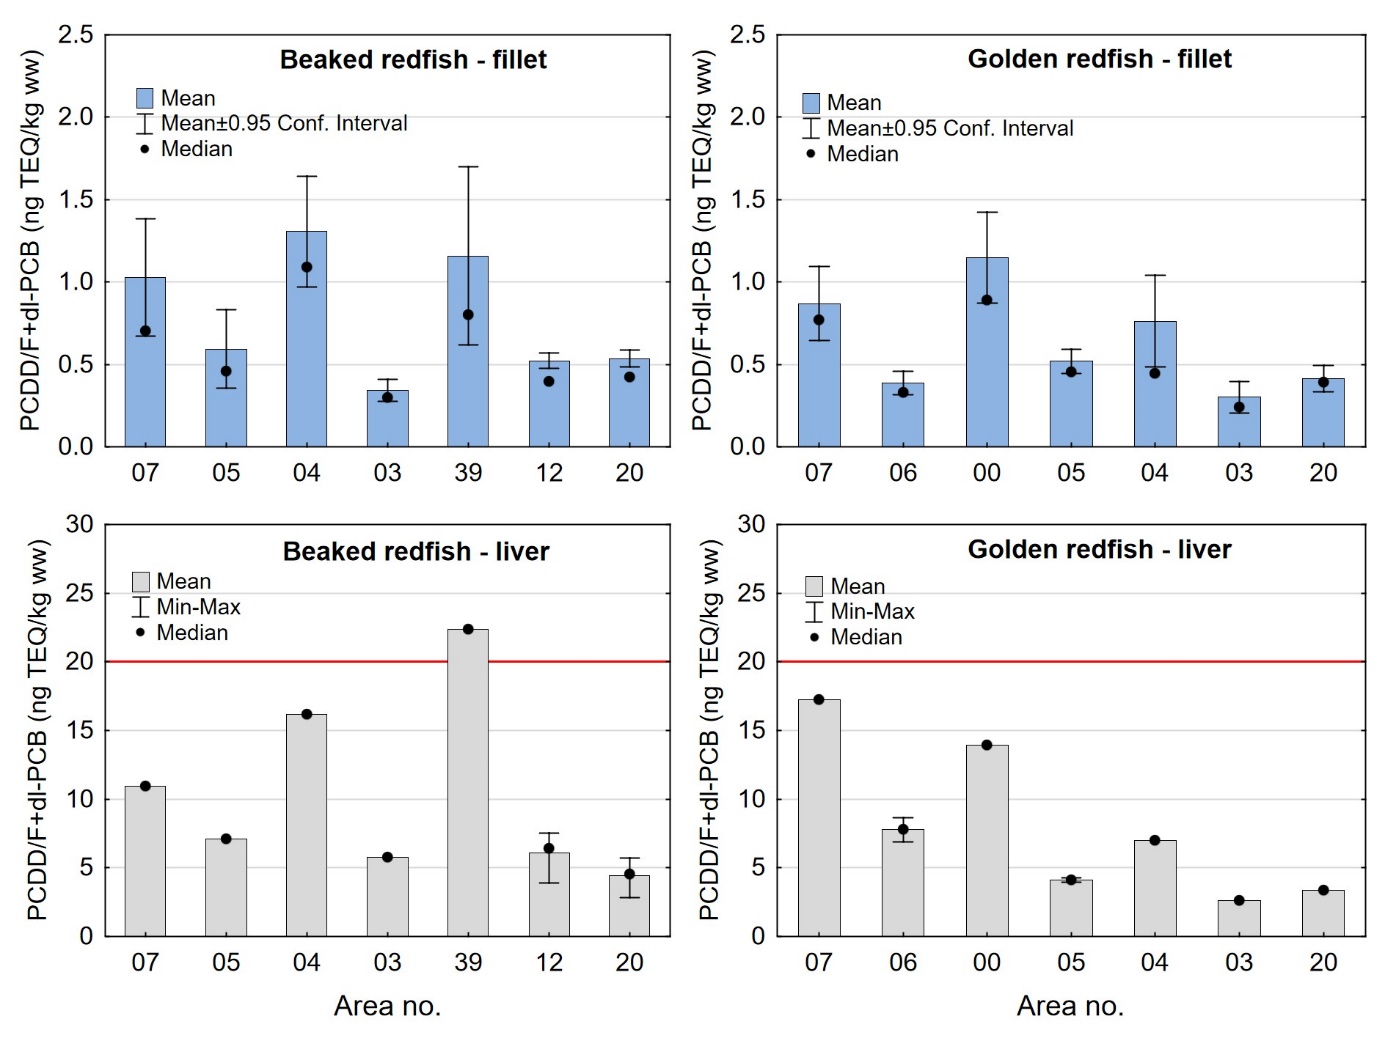
14. Concentration of sum PCDD/F+dl-PCB on wet
weight basis (ng TEQ/kg ww) in fillet
(upper panels) and liver (lower panels) of beaked redfish (left) and
golden redfish (right) sampled in different
areas in the Norwegian Sea and Barents Sea in 2016-2018. For fillet,
mean ± 95% confidence intervals and median (black dots) are given.
For liver, mean, min-max and median (black dots) are given. The red
horizontal line in the lower panels indicates the EU and Norway’s
maximum level for sum PCDD/F+dl-PCB in fish liver for human
consumption. PCDD/F+dl-PCB in fillet was determined in individual
fish, and PCDD/F+dl-PCB in liver was determined in composite samples
of liver from 23-25 fish from each station. For beaked redfish each
area contained one station, except area 12 (9 stations) and area 20
(7 stations). For golden redfish, each area contained one station,
except area 06 (2 stations).