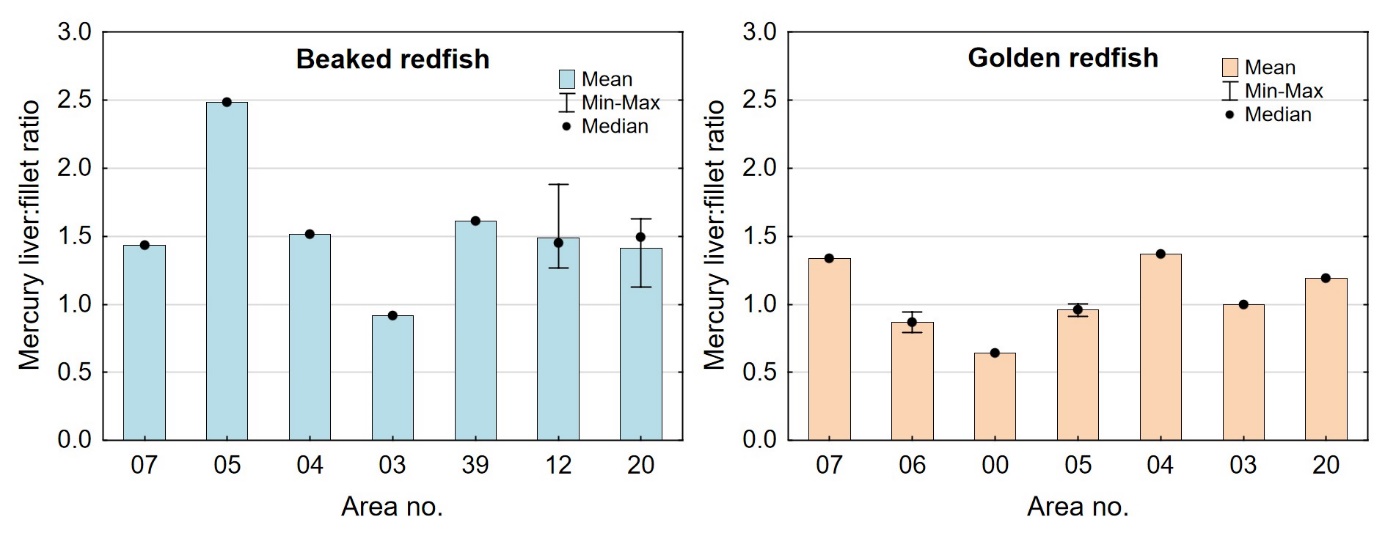
Figure
11. Variation in Hg liver:fillet ratio (Hg liver/Hg fillet) of beaked
redfish (left) and golden redfish (right) sampled in different areas
different areas in the Norwegian Sea and Barents Sea in 2016-2018.
Mean, minimum, maximum and median values are shown. The ratios are
calculated based on measured Hg values in composite liver samples and
mean values of the Hg concentrations in corresponding individual
fillet samples.