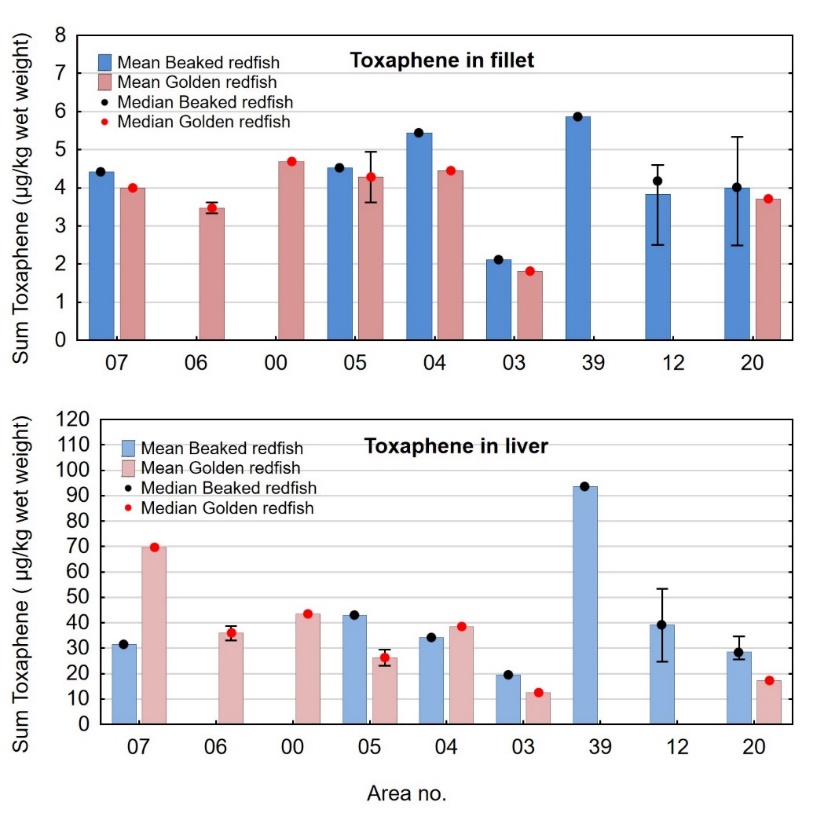
Figure
24. Concentration of sum toxaphene (µg/kg wet weight) in fillet
(upper panel) and liver (lower panel) of beaked redfish (blue bars)
and golden redfish (pink bars) sampled in different areas in the
Norwegian Sea and Barents Sea in 2016-2018. Mean, min-max and median
(black and red dots) are given. Sum DDT was determined in composite
samples of filet or liver from 23-25 fish from each station. For
beaked redfish each area contained one station, except area 12 (9
stations) and area 20 (7 stations). For golden redfish, each area
contained one station, except area 06 (2 stations).