Figure
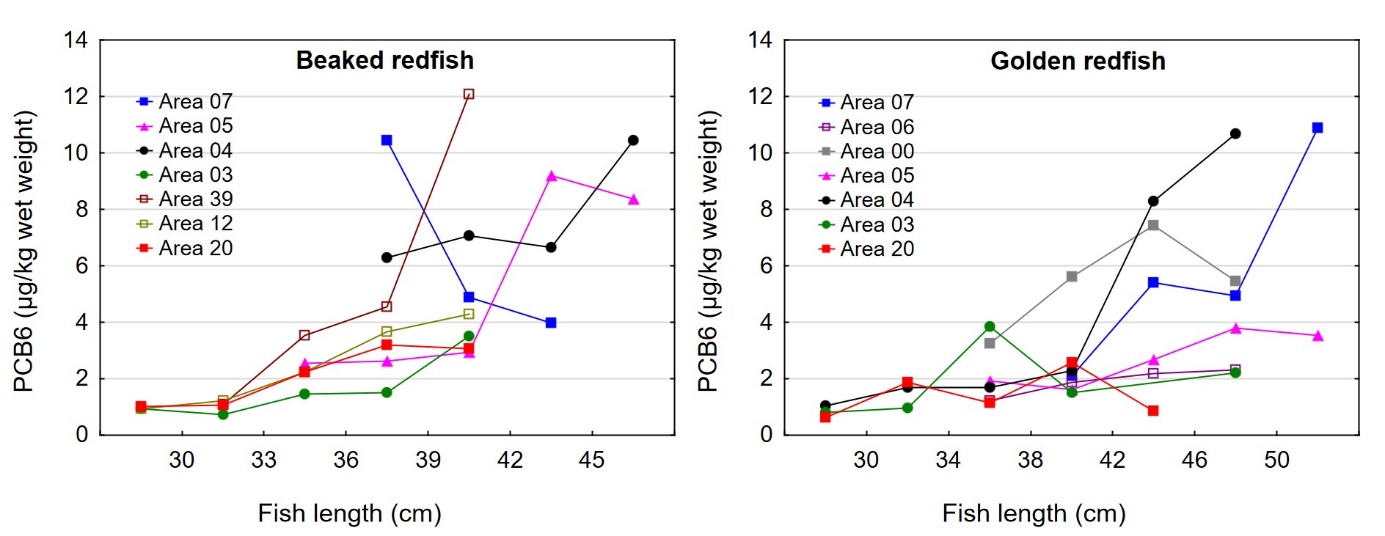
19. Concentration of sum PCB6 (µg/kg wet weight) in fillet of beaked
redfish (left) and golden redfish (right) in different fish length
intervals and categorised by statistics area. The different areas are
given different colours and symbols. Mean values are shown.