Figure
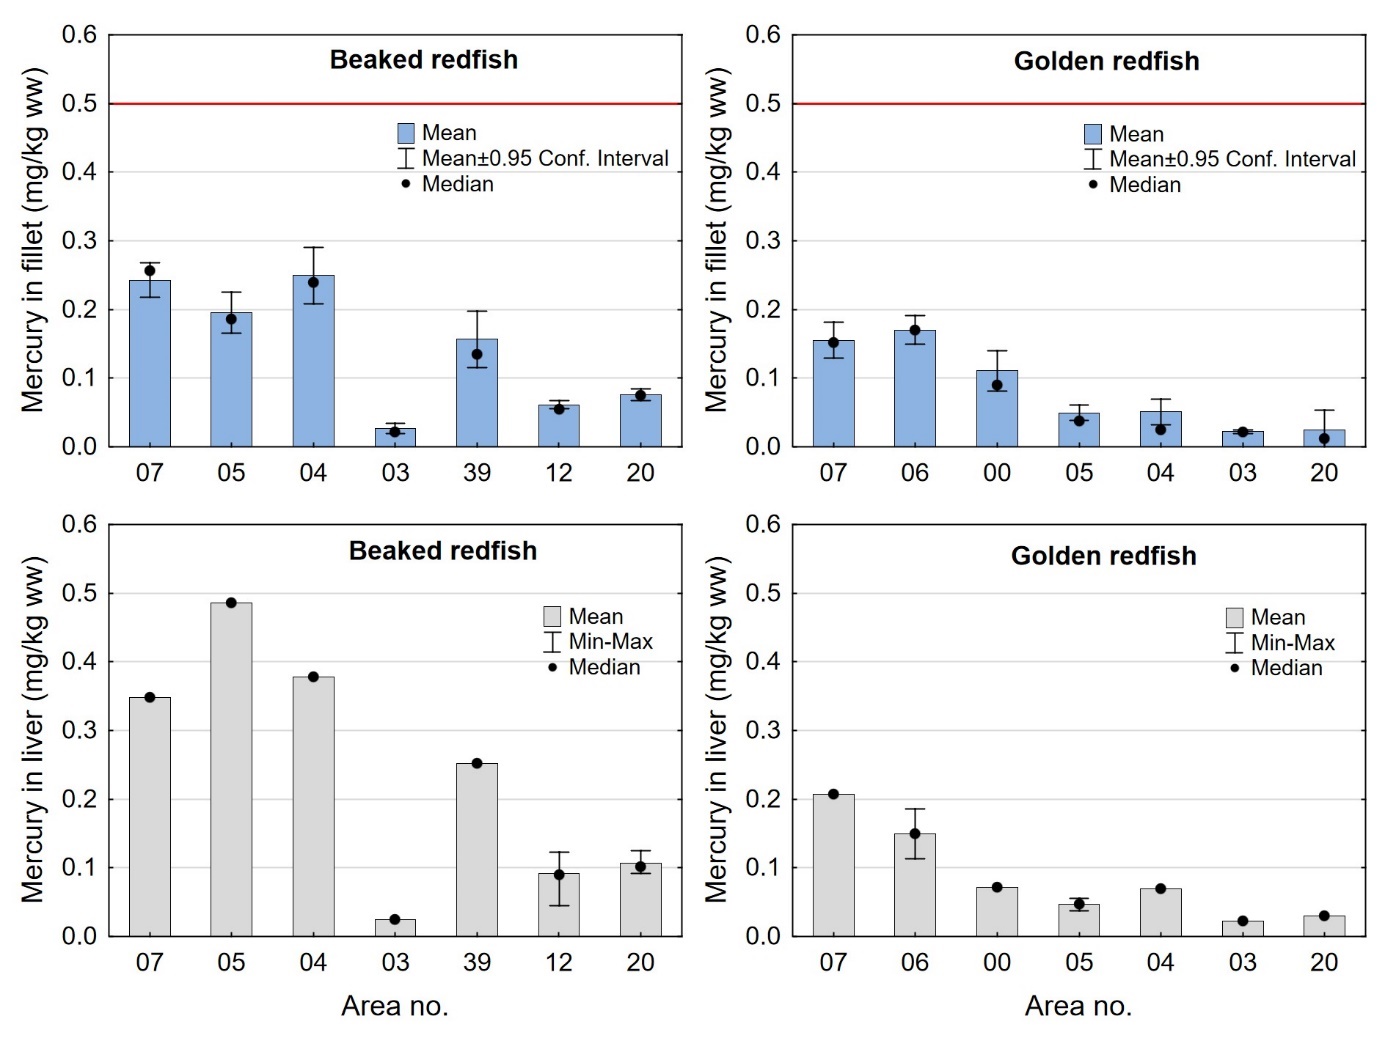
9. Concentration of mercury (mg/kg wet weight) in fillet (upper
panels) and liver (lower panels) of beaked redfish (left) and golden
redfish (right) sampled in different areas
(see figure 1 and 2 for geographical location of the different areas)
in the Norwegian Sea and Barents Sea in 2016-2018. For fillet, mean ±
95% confidence intervals and median (black dots) are given. For liver
mean, min-max and median (black dots) are given. The red horizontal
line indicates the EU and Norway’s maximum level for mercury in
fish fillet for human consumption, which does not apply to liver.
Mercury in fillet was determined in individual fish, and mercury in
liver was determined in composite samples of liver from 23-25 fish
from each station. For beaked redfish each area contained one
station, except area 12 (9 stations) and area 20 (7 stations). For
golden redfish, each area contained one station, except area 06 (2
stations).