Gå til hovedinnhold
Havforskningsinstituttet
HI
English
<- Tilbake
Søk
Søk
Søk
View page in English
Figur
Fra rapporten:
Nasjonalt tilsynsprogram for produksjon av skjell og andre bløtdyr
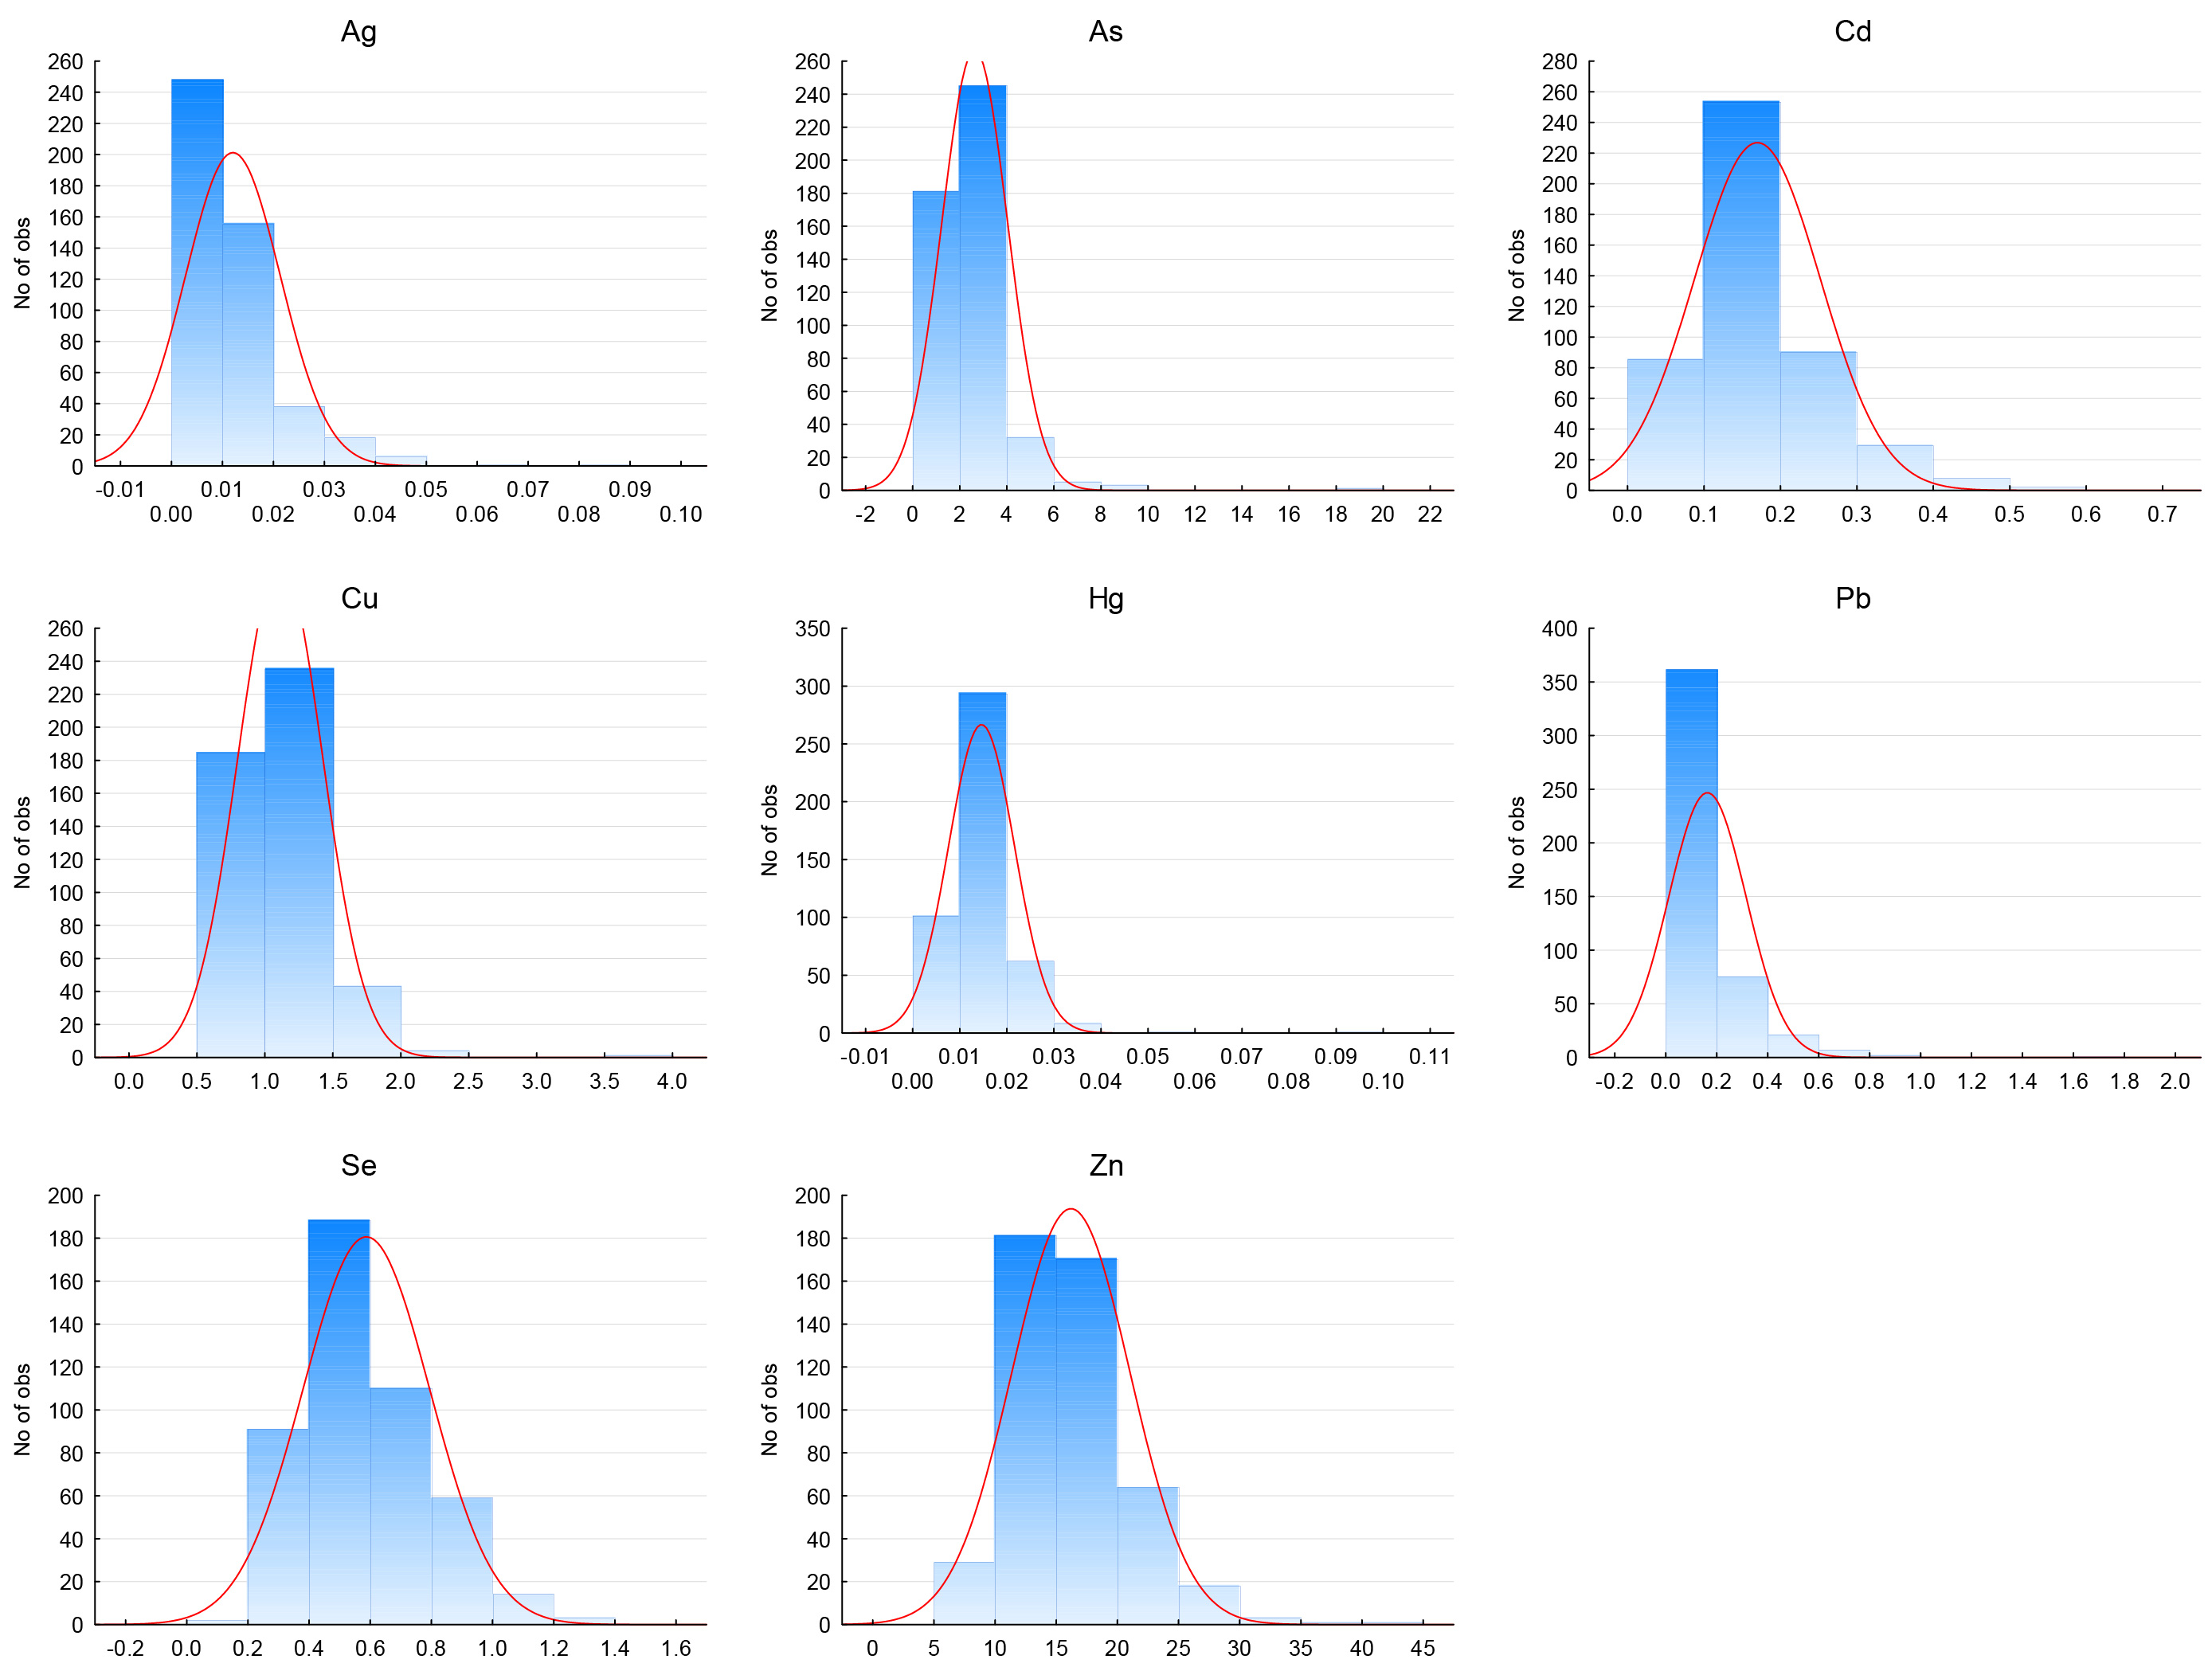
Figur 2 . Histograms showing the distribution of metal concentrations in mussels (Mytilus edulis) from the shellfish monitoring program between 2005 and 2014. Concentrations in mg/kg wet weight.