Figure
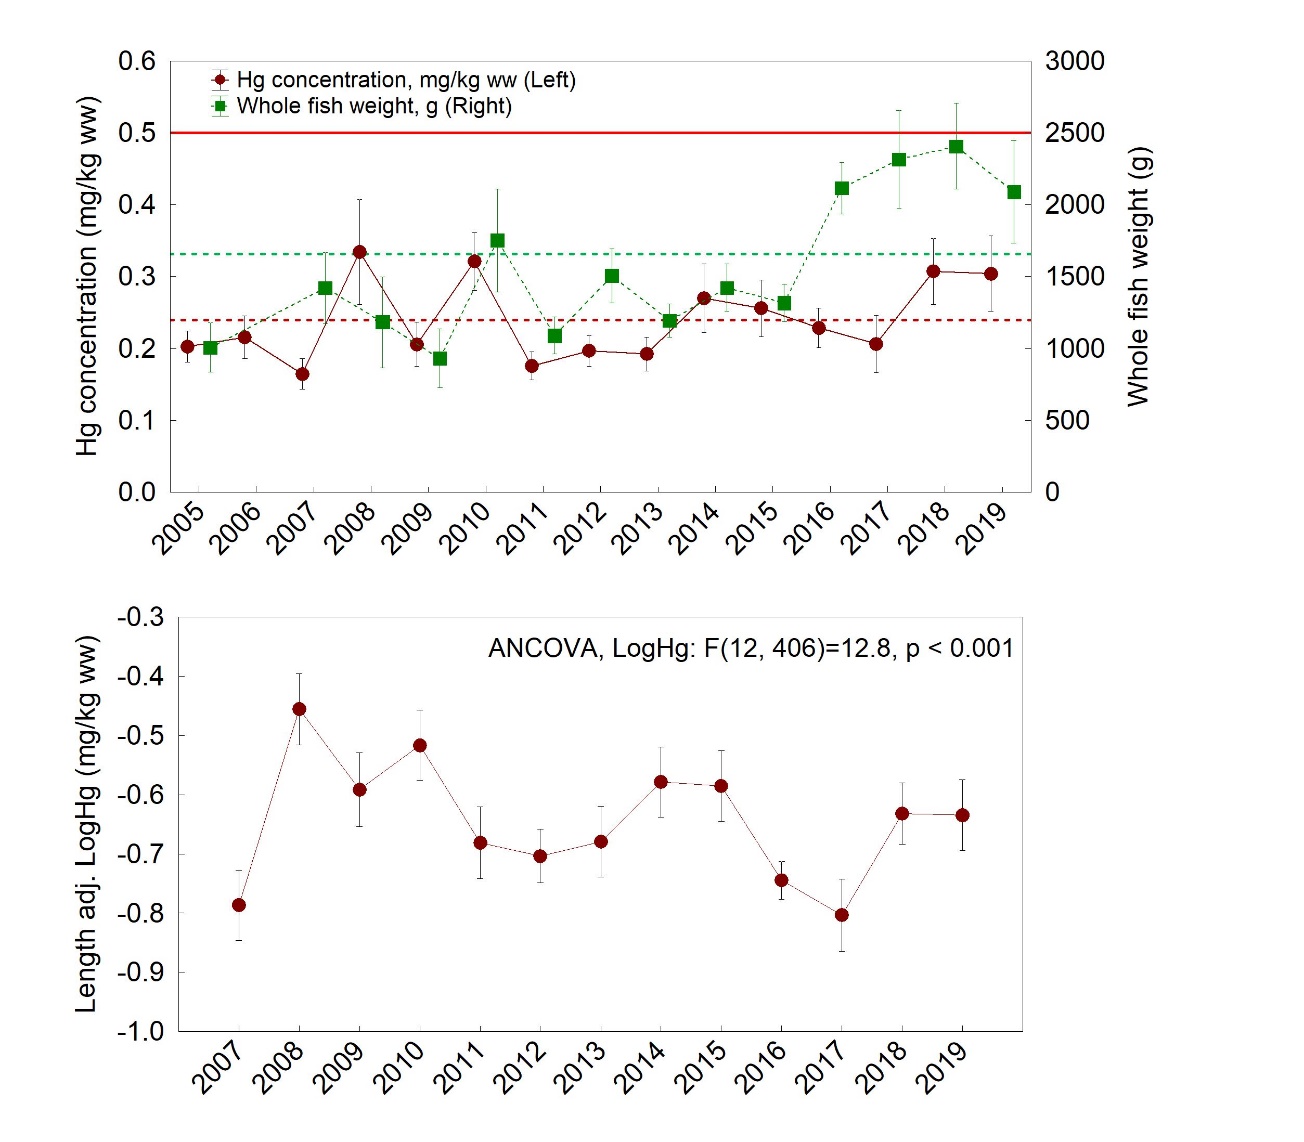
2. Year to year variation in mecury (Hg) concentrations (mg/kg wet
weight, ww) in fillet of tusk ( Brosme
brosme ) caught
near the wreck of U-864 . Top:
Concentration of Hg (mg/kg ww, left) and fish weight (g, right) every
year from 2005-2019. For each year, mean ± 95% confidence
intervals are given, and median values are shown as separate points.
The long term mean values are shown as dotted horizontal lines for Hg
(maroon) and for fish weight (green). EU and Norway’s maximum
level for Hg is marked with a continuous red line. Bottom: Length
adjusted Log 10 Hg
(Least square means) per year (2007-2019) obtained by ANCOVA with
fish length as covariate. ANCOVA
results are shown.