Figure
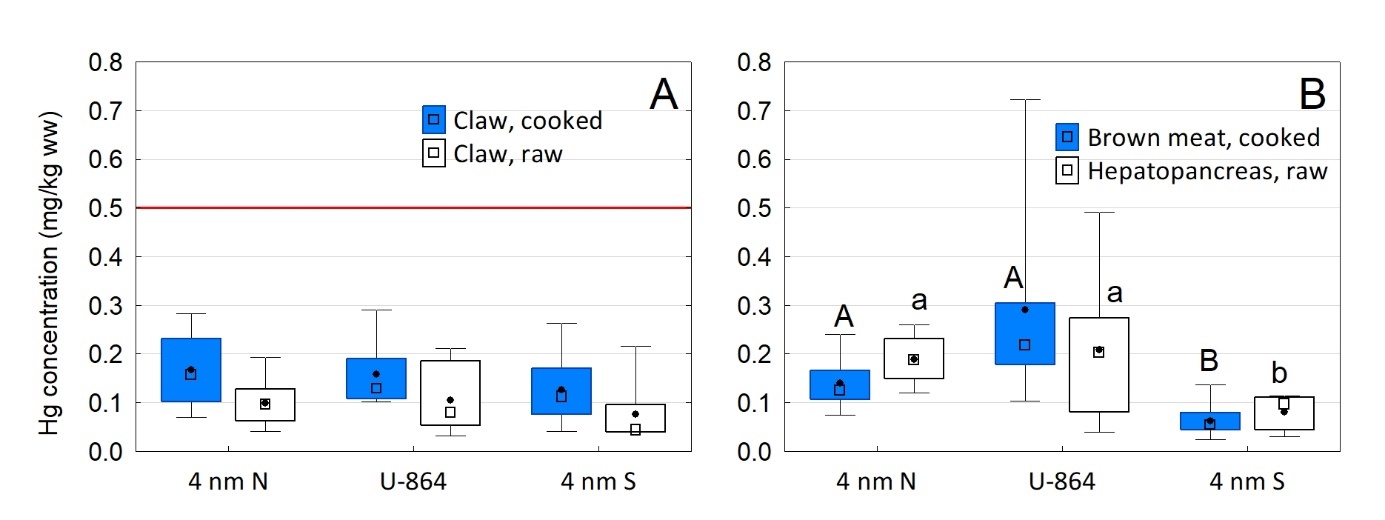
4. Total mercury concentration on wet weight (Hg, mg/kg ww) in crab
( Cancer
pagurus ) caught at the wreck
of U-864 (U-864), four nautical miles north of the wreck (4 nm N) and
four nautical miles south of the wreck (4 nm S). Results are given
for A) Claw meat of cooked and raw crab and B) hepatopancreas of raw
crab and brown meat of cooked crab. Boxplots show medians, quartiles,
minimum and maximum values, and small black dots are mean values. The
red line in A marks the EU and Norway’s maximum level set for
food safety. Where statistical significances are found
(Kruskal-Wallis non-parameteric test, p<0.05), differences between
groups are marked with different letters above the bars.