Gå til hovedinnhold
Havforskningsinstituttet
HI
English
<- Tilbake
Søk
Søk
Søk
View page in English
Figur
Fra rapporten:
Measuring distribution and density of sprat in Årdalsfjorden with a kayak drone
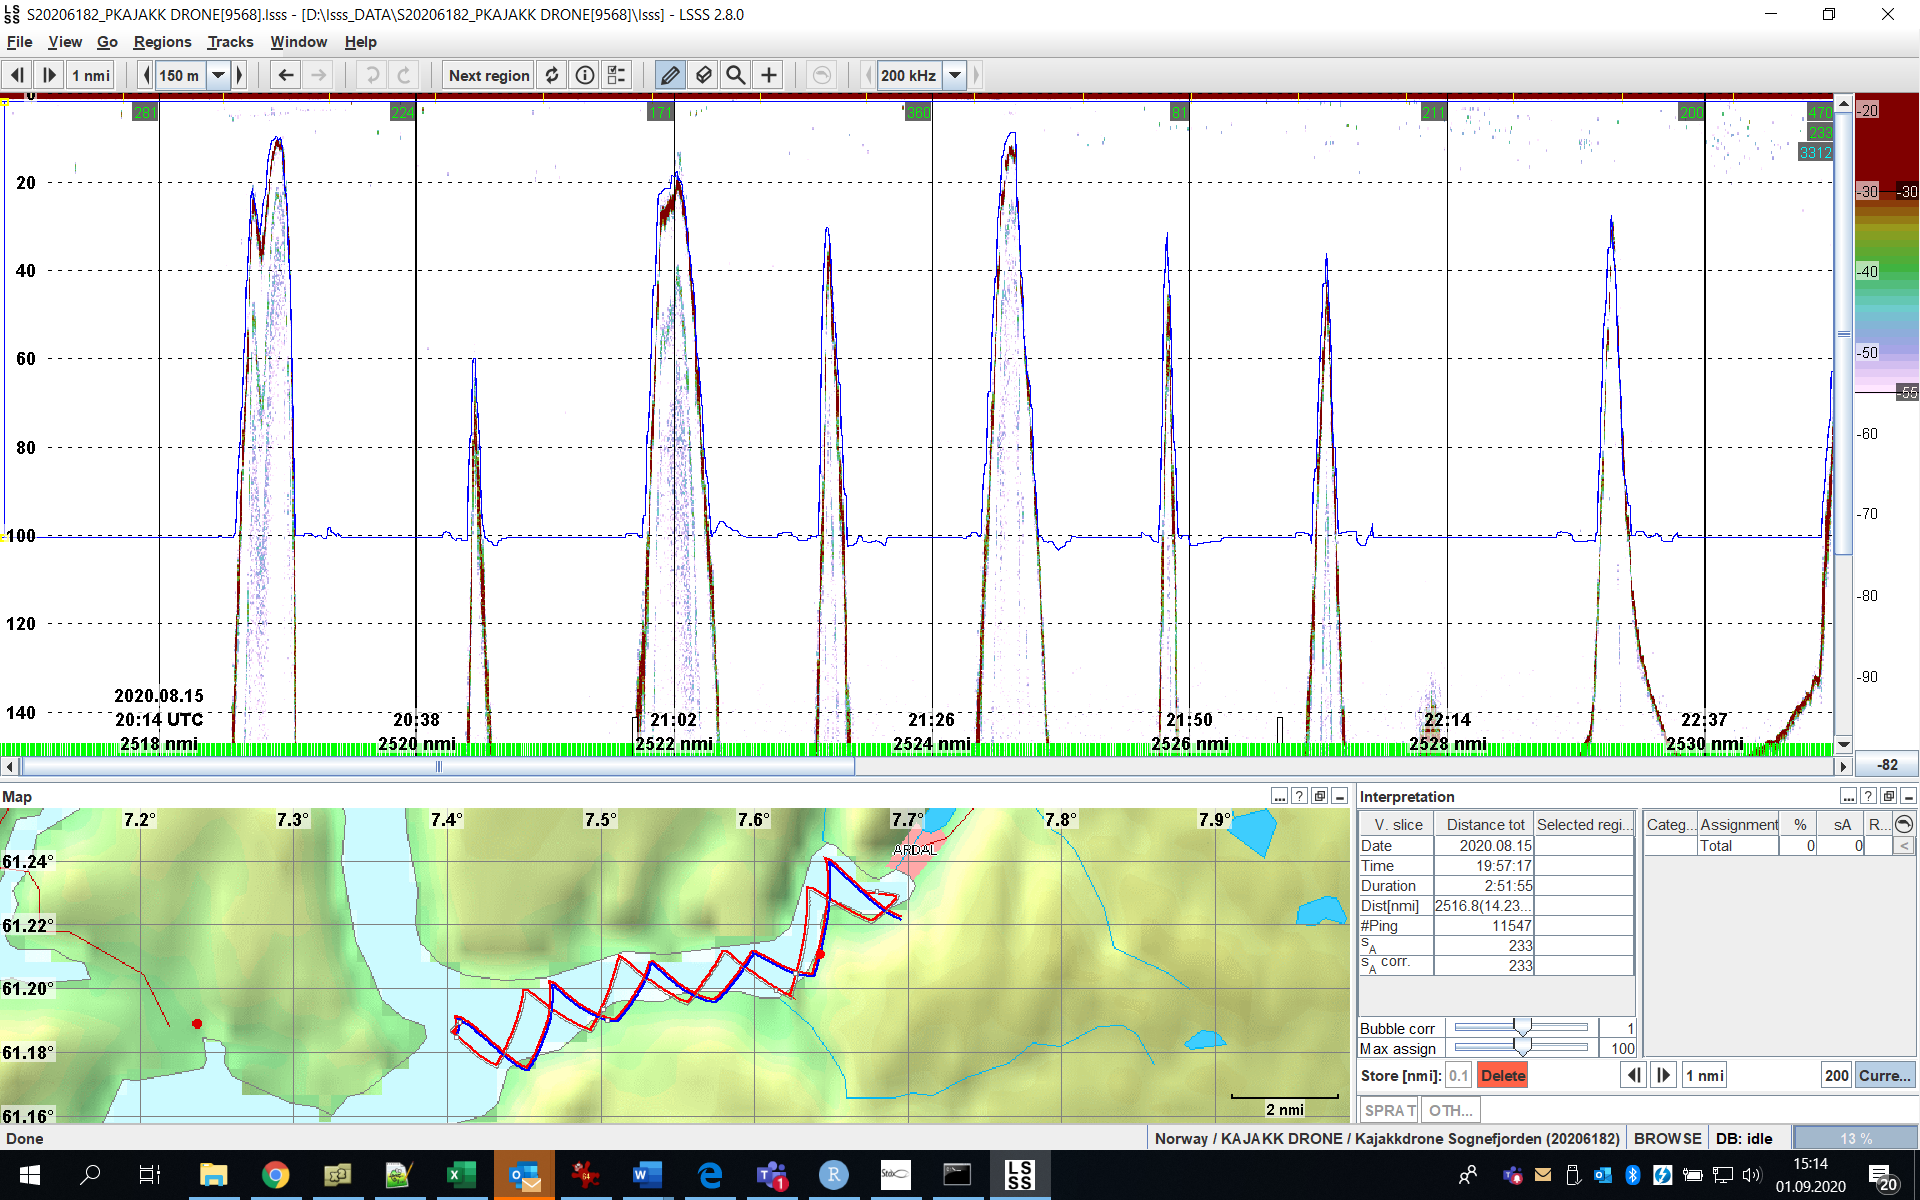
Figure 6 Screen dump of the LSSS software. Top picture: Echogram of the second run. Bottom left: Map of both runs (run1 is depicted as a red line and run2 is depicted as blue line). Bottom right: Acoustic categorizing window.