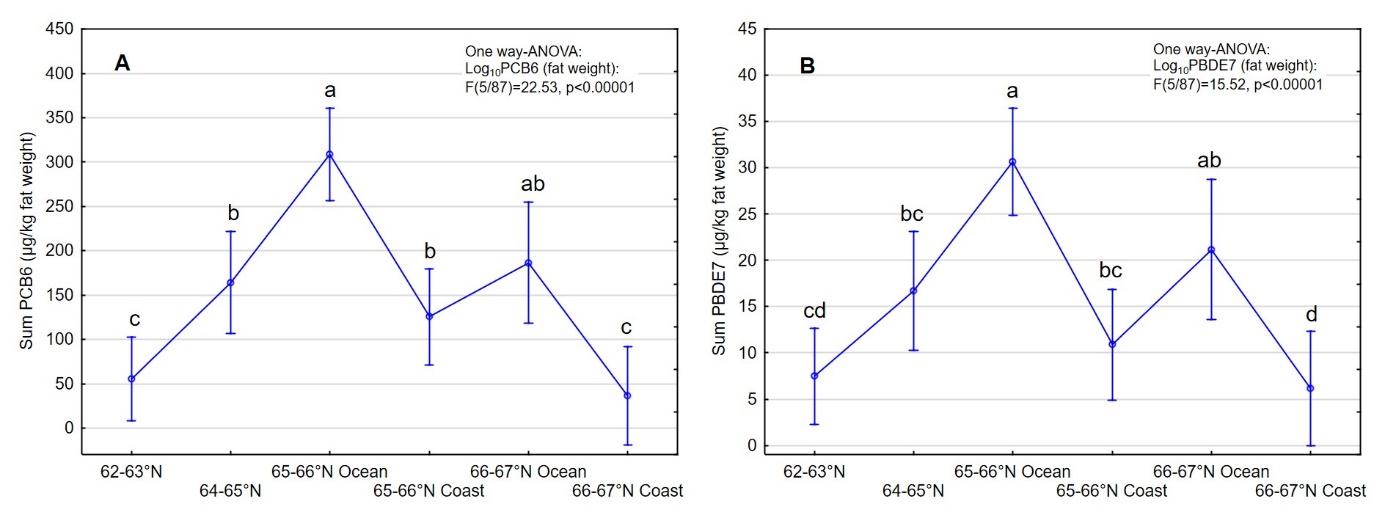
Figure 14. Concentrations of A) sum PCB6 and B) sum PBDE7 on fat weight basis (µg/kg fat weight) in muscle (B-cut) of Atlantic halibut collected in different areas in the Norwegian Sea in 2019. Least square mean ± 95% confidence interval is shown for each area. Results of ANOVA are shown in the graph. Letters above the graph indicate significant or non-significant differences between the areas, i.e. different letters indicate significant difference between the areas, while one or more identical letters indicate no significant difference between the areas. ANOVA was performed on log10-transformed concentrations and raw data are presented in the graph.