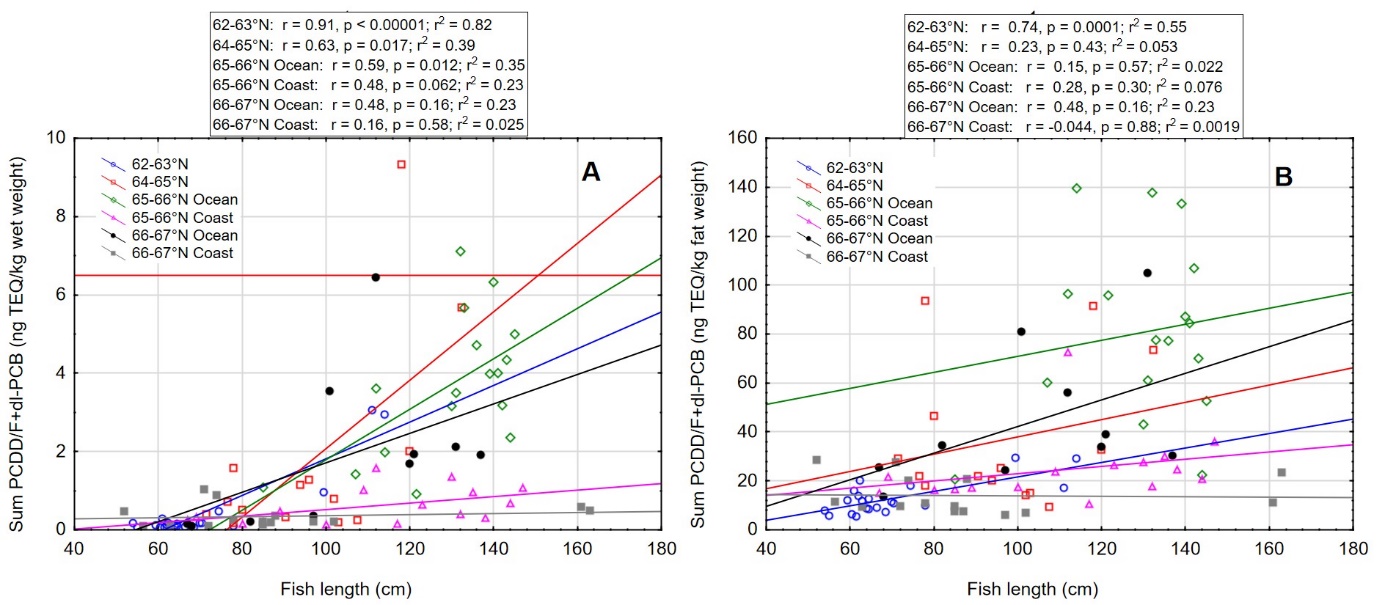
Figur 9. Linear regression between concentration of sum PCDD/F+dl-PCB on A) wet weight basis (ng TEQ/kg wet weight) or B) fat weight basis (ng TEQ/kg fat weight) and fish length (cm) for Atlantic halibut collected in different areas in the Norwegian Sea in 2019 (see figure 1 for geographical location of the different areas). Halibut from area 65-66°N Ocean were collected within (12 fish) and right outside of (5 fish) the area closed for halibut fishing. The red horizontal line in (A) indicates the EU and Norway’s maximum level for sum PCDD/F+dl-PCB in muscle meat of Atlantic halibut for human consumption. Results of Pearson’s linear correlation for each area are given above the graph.