Gå til hovedinnhold
Havforskningsinstituttet
HI
English
<- Tilbake
Søk
Søk
Søk
View page in English
Figur
Fra rapporten:
Fiskeriakustikk og akustisk målklassifisering
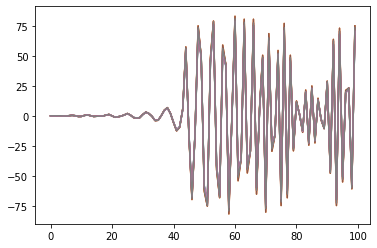
Figure 9. The first 100 samples from the real (left panel) and complex (right panel) values from quadrant 1.