Gå til hovedinnhold
Havforskningsinstituttet
HI
English
<- Tilbake
Søk
Søk
Søk
View page in English
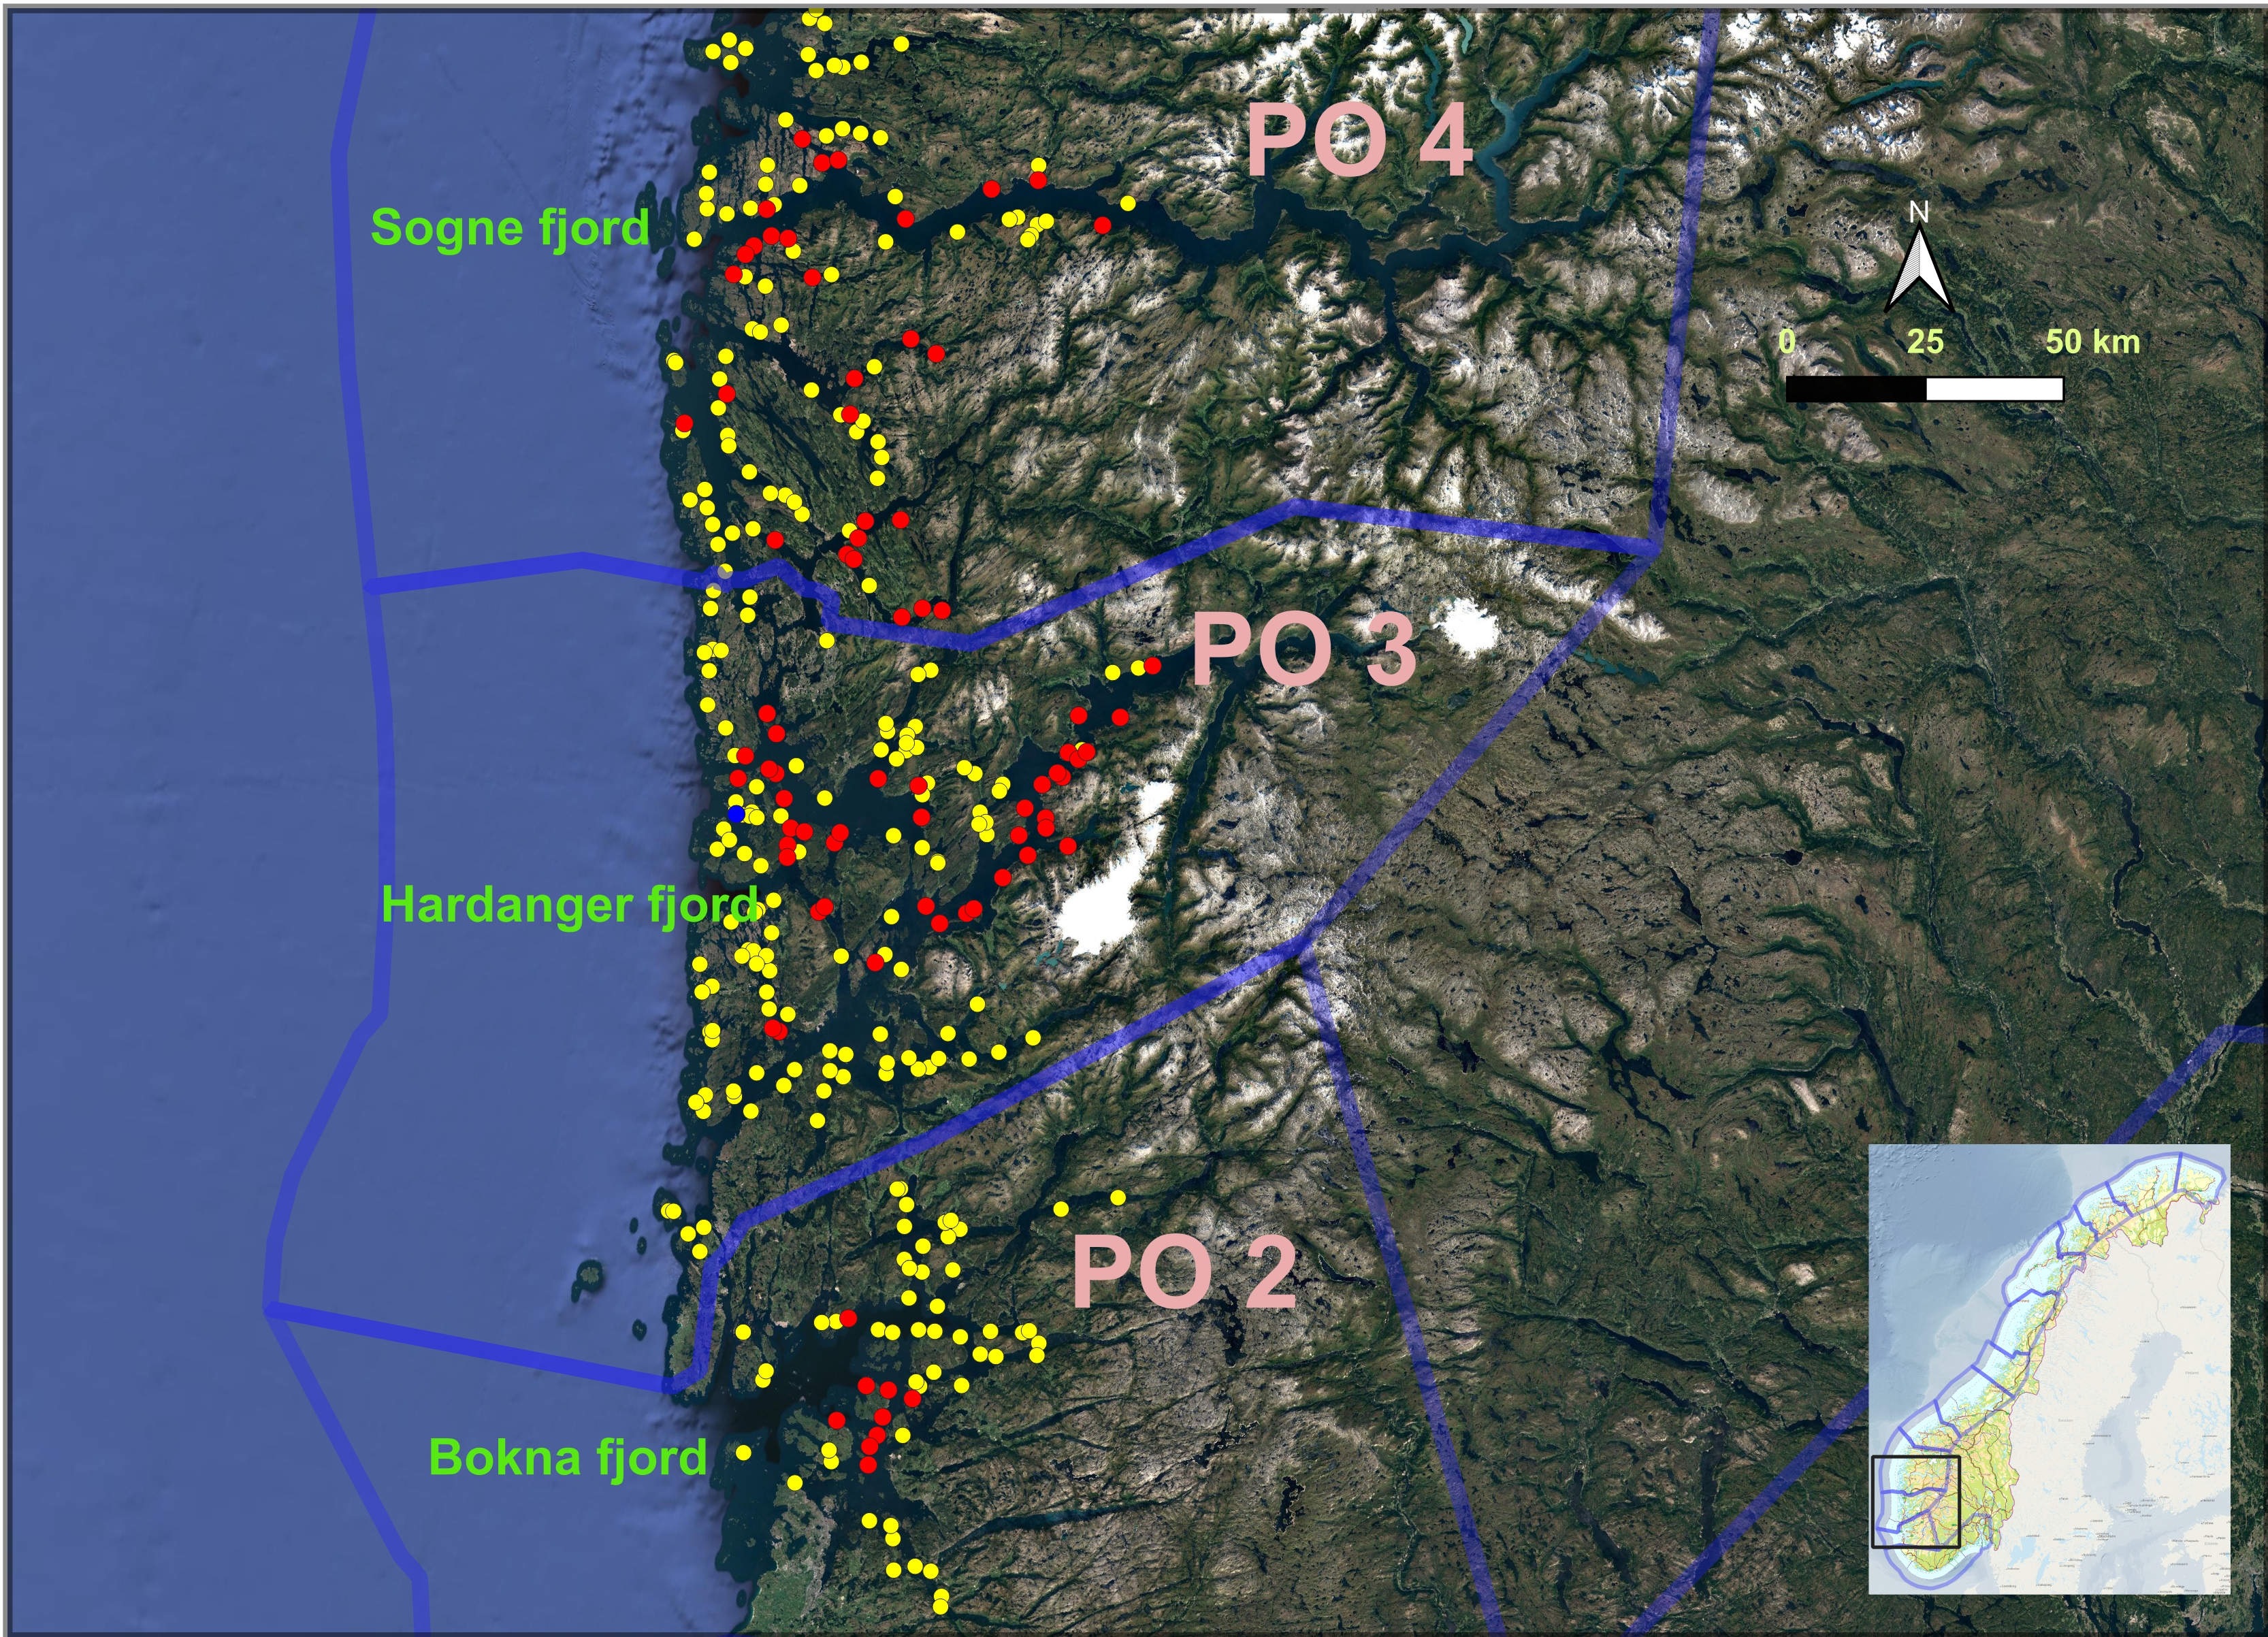
Figur
Fra rapporten:
Annual report on health monitoring of wild anadromous salmonids in Norway 2020
Fig. 1: Map showing postsmolt collection fjords, the fish farming sites (yellow circle) and sites with PD (red circle) and ISA (blue circle) outbreak during the period May-June 2019.