Gå til hovedinnhold
Havforskningsinstituttet
HI
English
<- Tilbake
Søk
Søk
Søk
View page in English
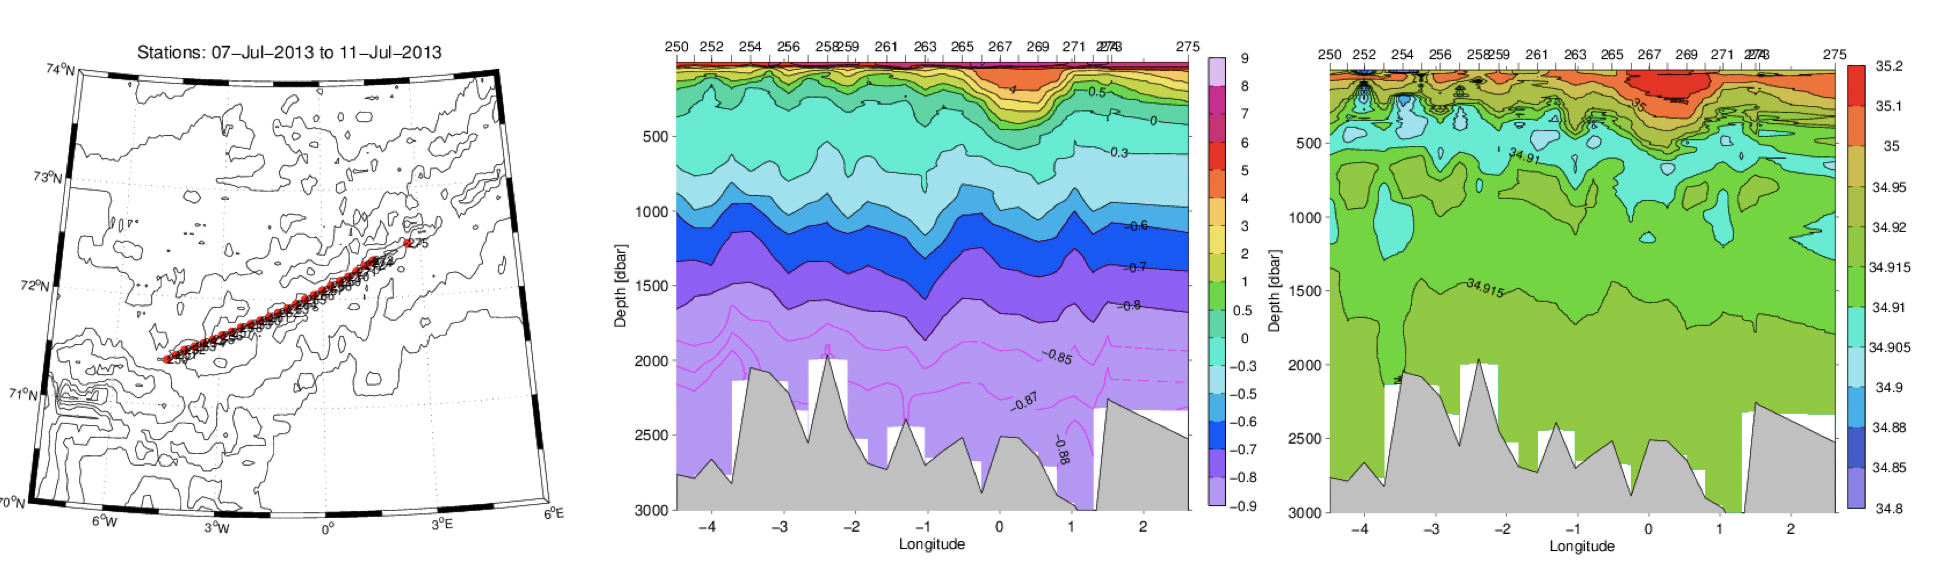
Figur
Fra rapporten:
Pelagiske økosystem i De nordiske hav
Figur 2.16. CTD-stasjoner, temperatur (°C) og saltholdighet i et hydrografisk snitt over Mohnsryggen juli 2013.