Gå til hovedinnhold
Havforskningsinstituttet
HI
English
<- Tilbake
Søk
Søk
Søk
View page in English
Figur
Fra rapporten:
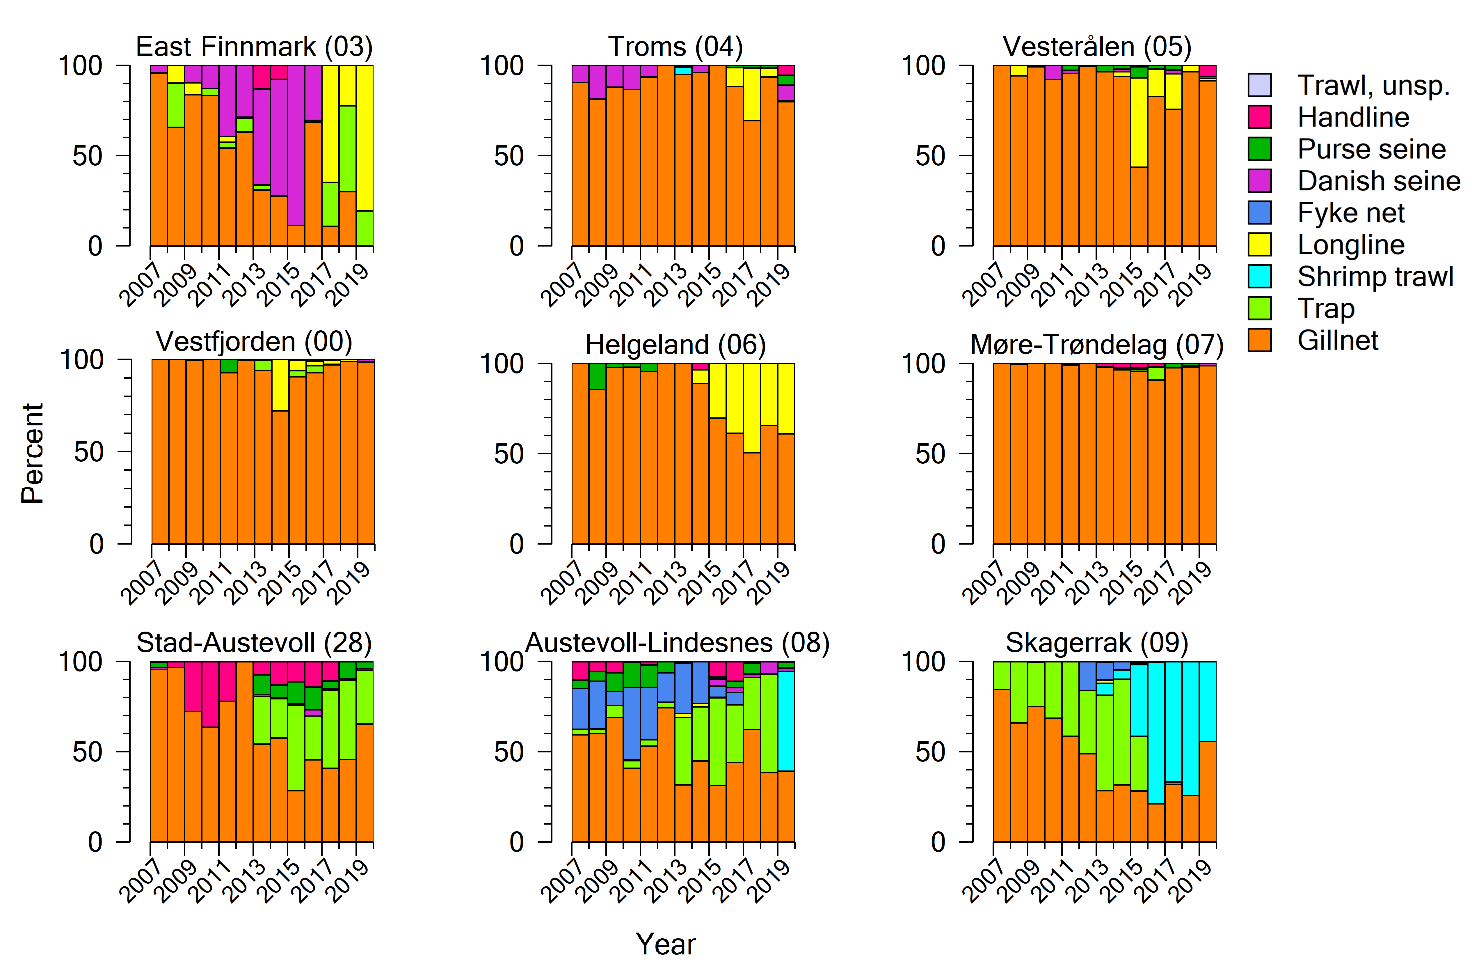
The Coastal Reference Fleet 2007-2019
Figure 7. The percent of fishing operations by the Norwegian Coastal Reference Fleet per gear category per year in each statistical area. Figur 7. Prosentvis fordeling av Kystreferanseflåtens redskapsbruk per år i hvert statistiske område.