Gå til hovedinnhold
Havforskningsinstituttet
HI
English
<- Tilbake
Søk
Søk
Søk
View page in English
Figur
Fra rapporten:
The Coastal Reference Fleet 2007-2019
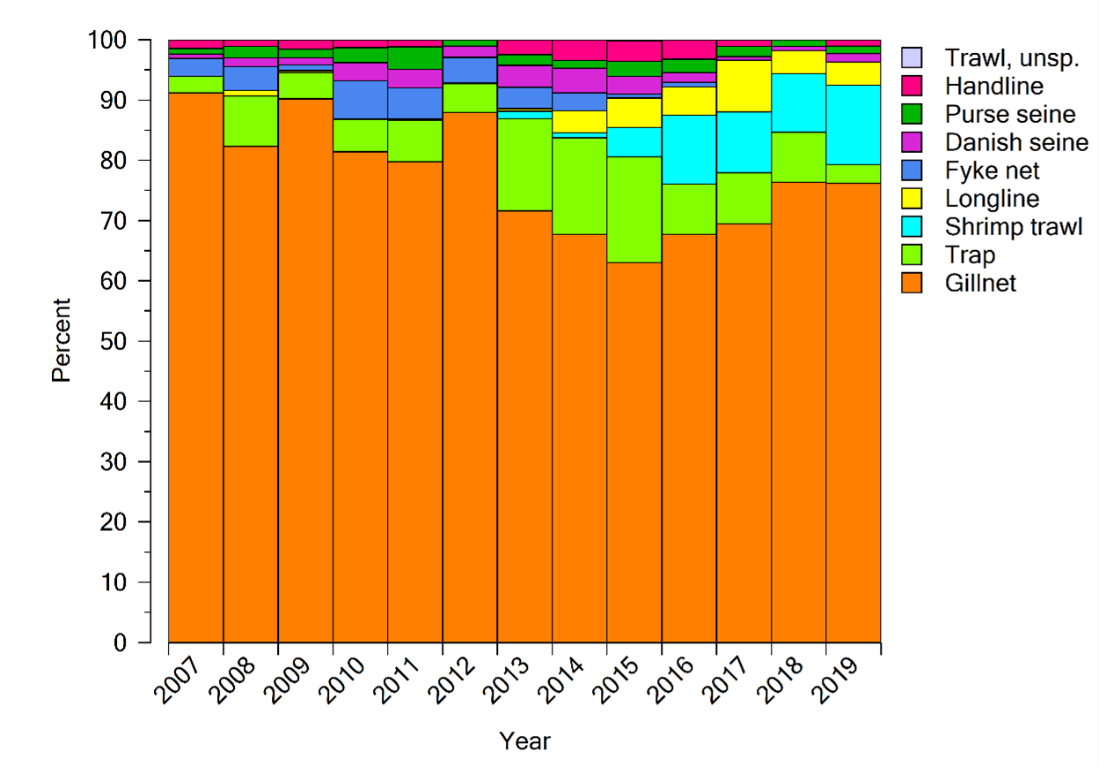
Figure 6. The percent of fishing operations per gear category per year by the Norwegian Coastal Reference Fleet. Figur 6. Prosentvis fordeling av Kystreferanseflåtens redskapsbruk per år.