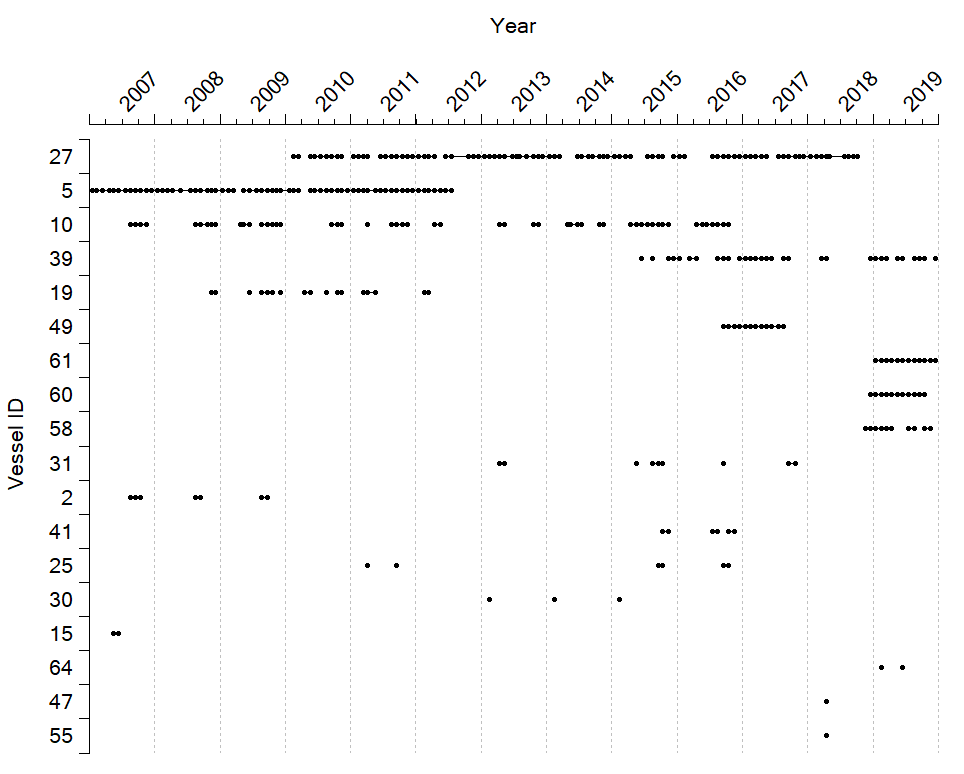
Figure ix. The number of vessels contributing data to the Norwegian Coastal Reference Fleet in the statistical area Austevoll-Lindesnes (08). Each dot represents a month, and each line on the y-axis is a unique vessel. The vessels are sorted by how many months in which they registered data. A table with vessel ID and the corresponding call sign can be found in Appendix 3
Figur ix. Antall fartøy som samlet inn data i Kystreferanseflåten i det statistiske området Austevoll-Lindesnes (08). Hver prikk representerer én måned, og hver linje på y-aksen er et unikt fartøy. Båtene er sortert basert på hvor mange måneder en båt har samlet inn data. En oversikt over vessel ID og korresponderende kallesignal er i Vedlegg 3.