Gå til hovedinnhold
Havforskningsinstituttet
HI
English
<- Tilbake
Søk
Søk
Søk
View page in English
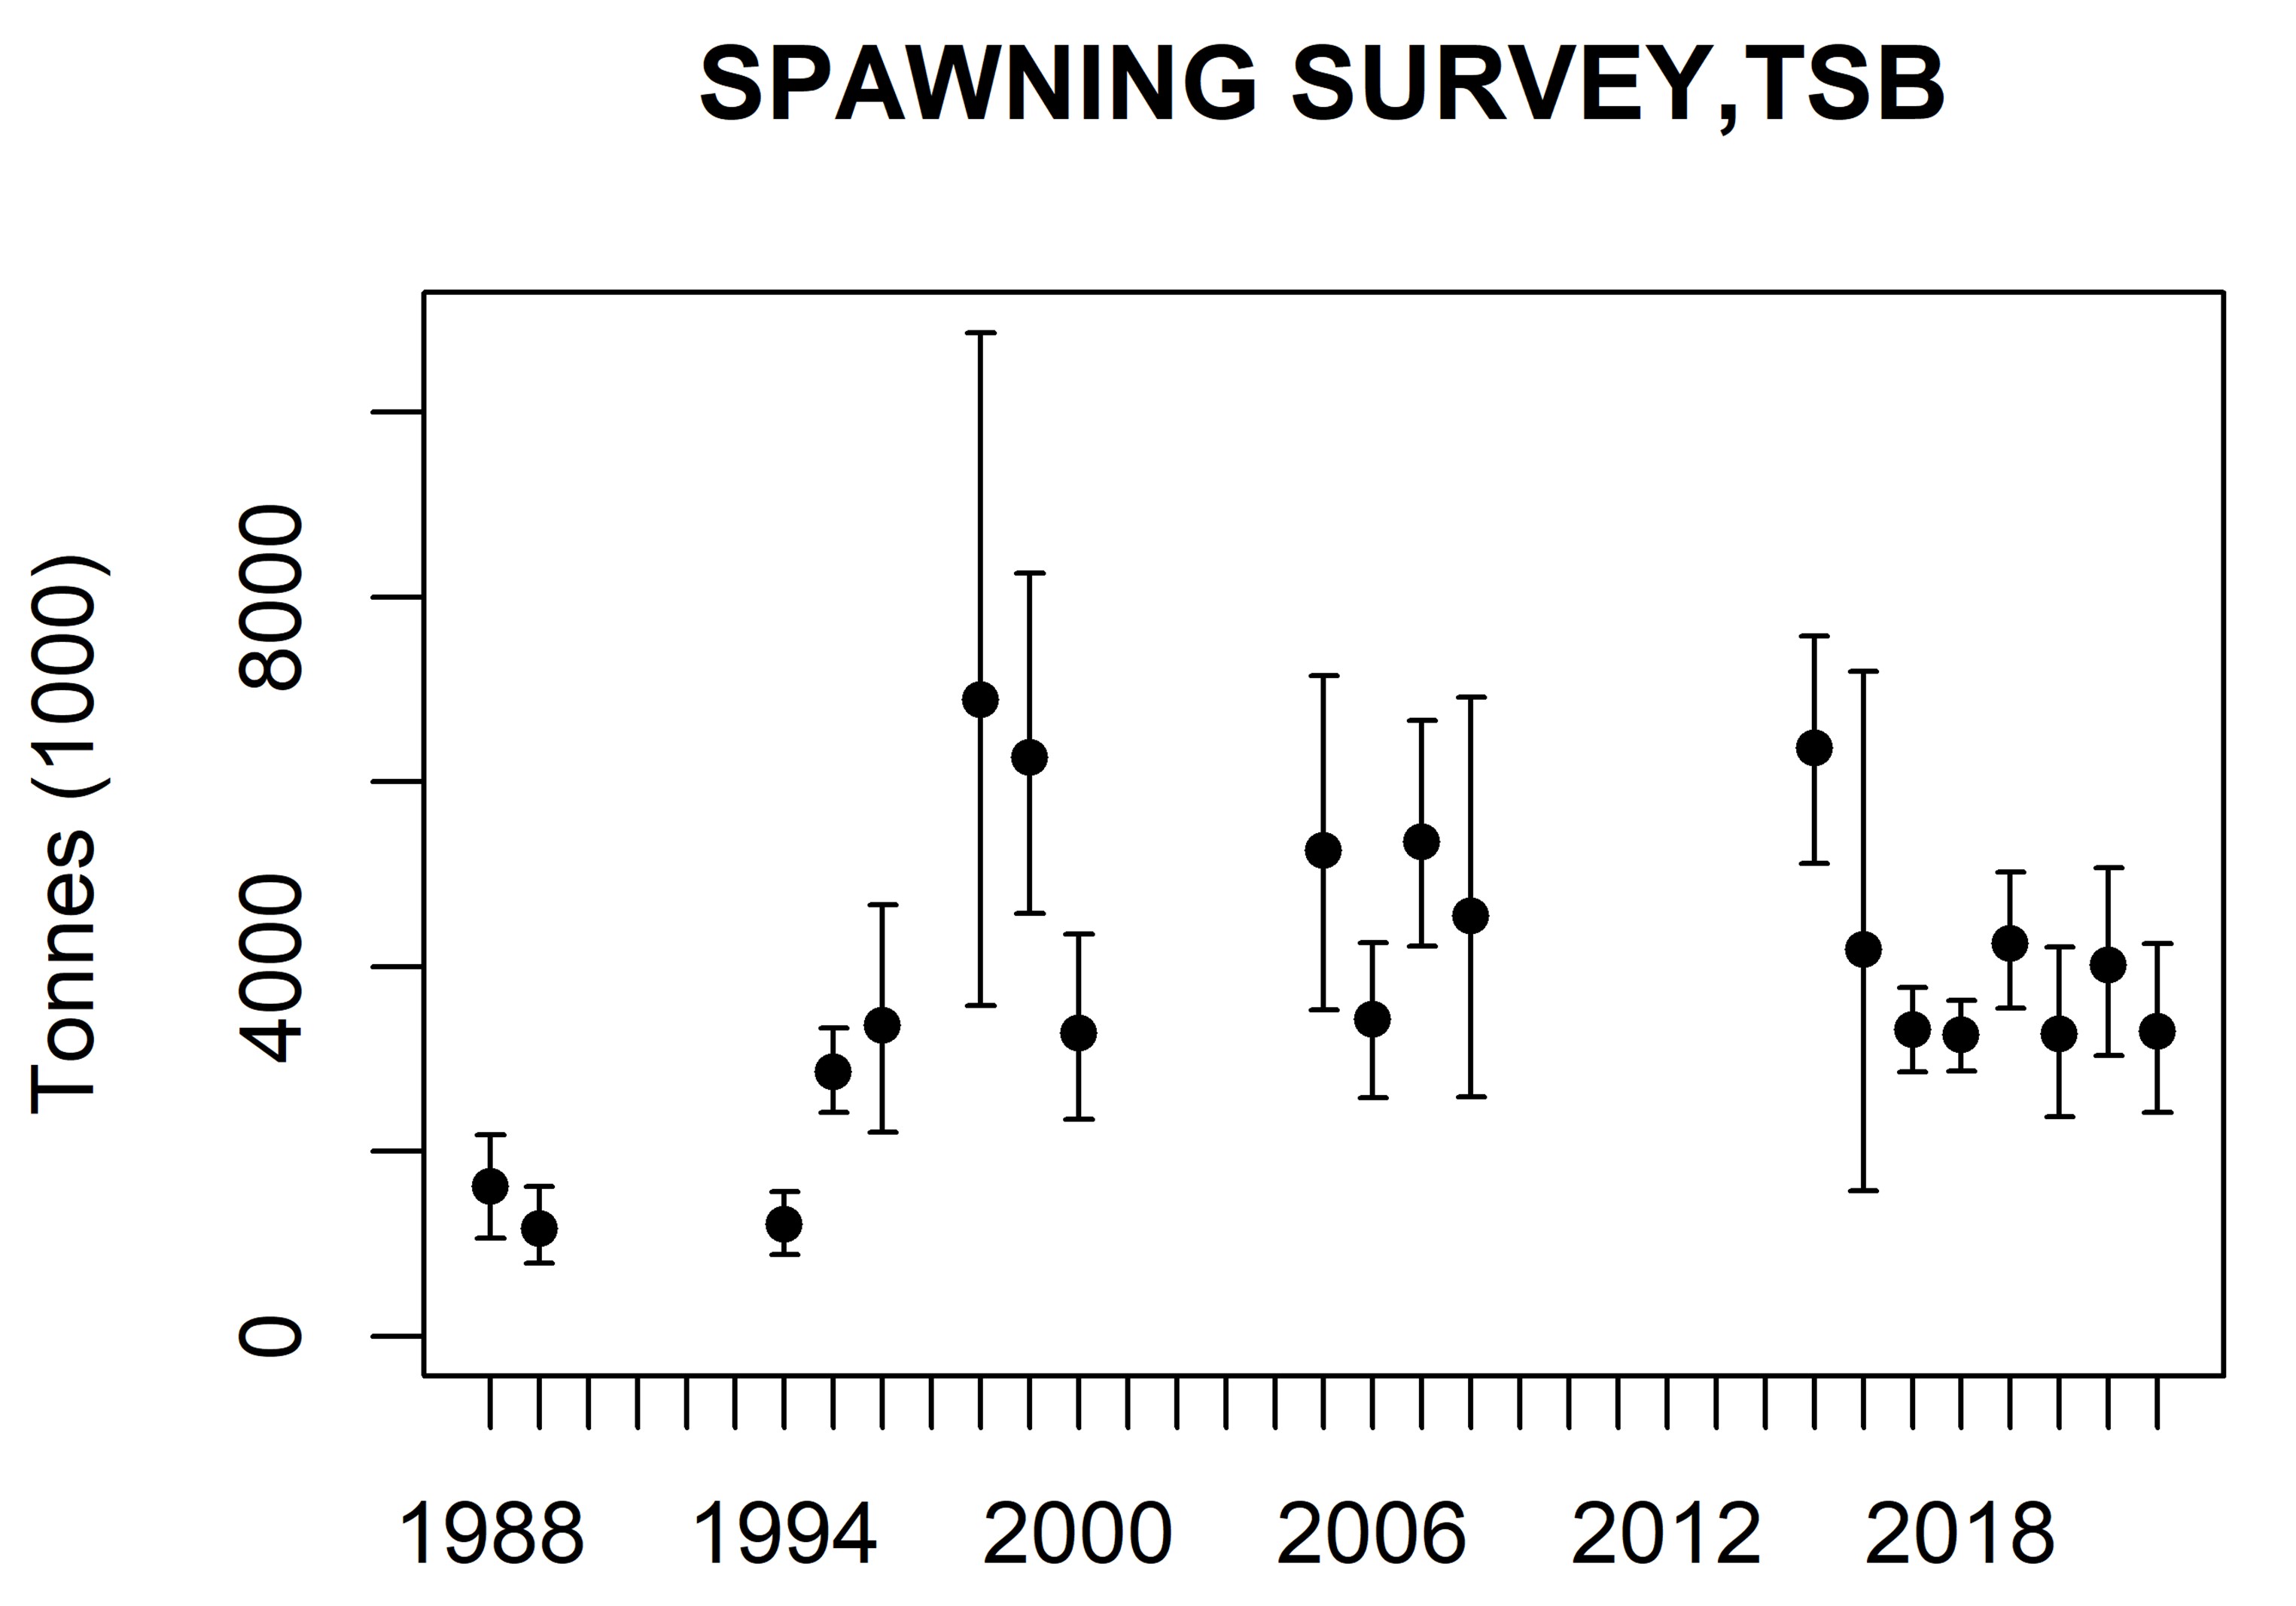
Figur
Fra rapporten:
Distribution and abundance of Norwegian spring-spawning herring during the spawning season in 2022
Figure 4. Estimates of total biomass from the Norwegian spring-spawning herring spawning surveys during1988-2022. The estimates are mean of 1000 bootstrap replicates and the error bars represent 90 % confidence intervals.