Gå til hovedinnhold
Havforskningsinstituttet
HI
English
<- Tilbake
Søk
Søk
Søk
View page in English
Figur
Fra rapporten:
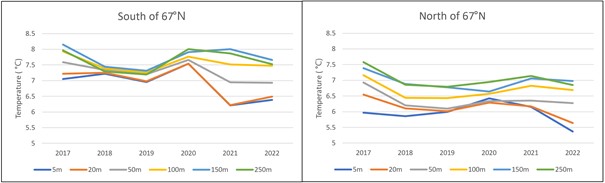
Distribution and abundance of Norwegian spring-spawning herring during the spawning season in 2022
Figure 10. Mean temperatures at 5, 20, 50, 100, 150, 250 m in the area covered during the Norwegian spring-spawning herring spawning surveys in 2017-2022.