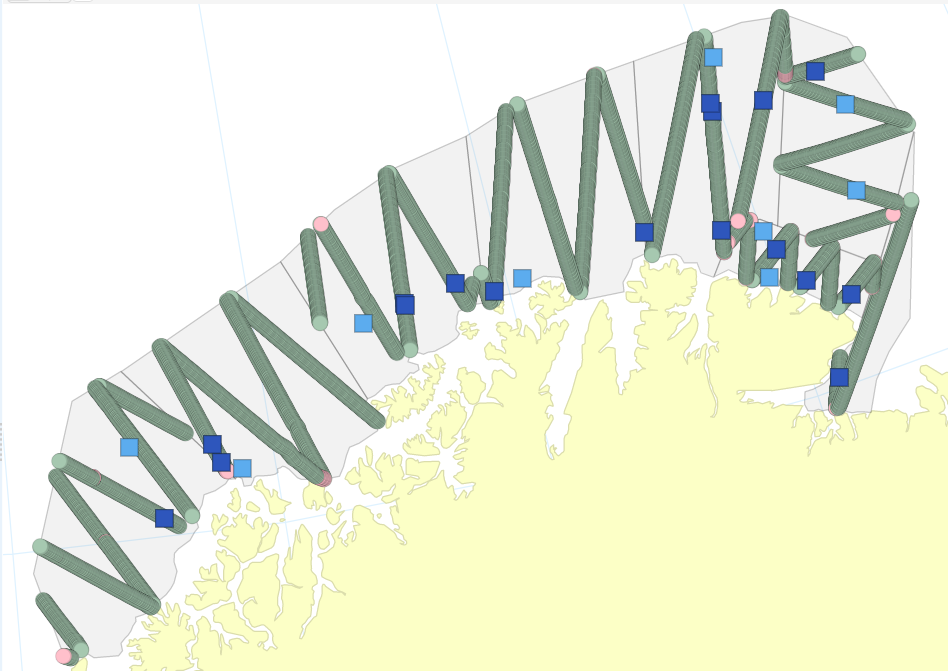
Fig. 3. Overview of transects (green: included in the biomass estimation, pink: not included in the biomass estimation). Blue squares mark trawl stations, with dark blue denoting those stations included in the estimation (only stations from east-west coverage included). The gray shaded areas mark the strata (counting 1-8 from west to east).