Gå til hovedinnhold
Havforskningsinstituttet
HI
English
<- Tilbake
Søk
Søk
Søk
View page in English
Figur
Fra rapporten:
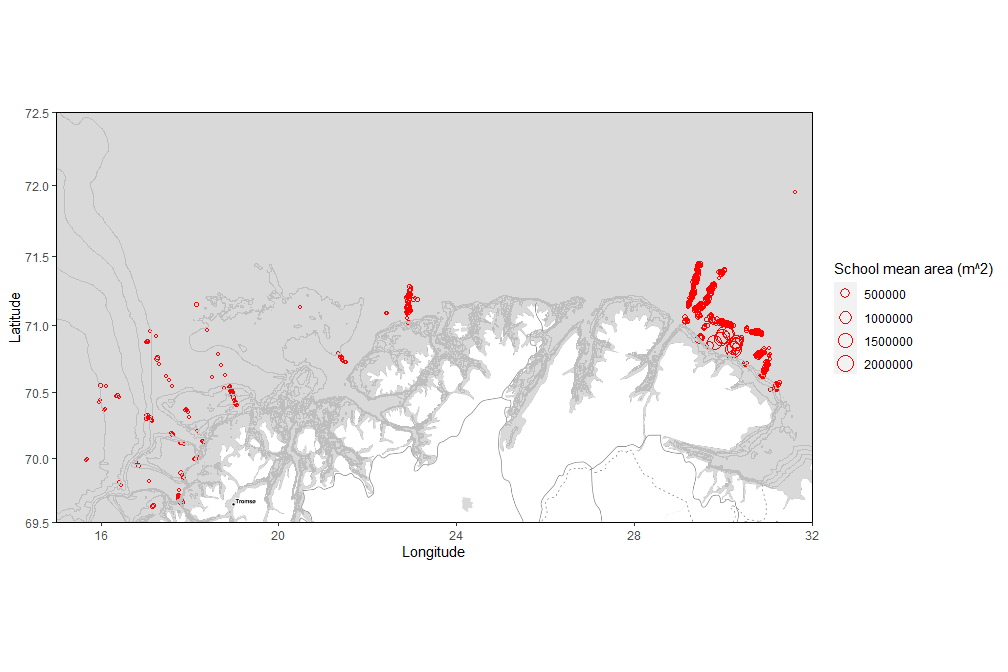
Testing of trawl-acoustic stock estimation of spawning capelin 2022
Fig. 6. Capelin aggregations (schools and layers) observed with sonar from Eros and Vendla during the first west-east (upper panel) and the second east-west (lower panel) coverage. Aggregations with mean area above 5 000 m2 are shown.