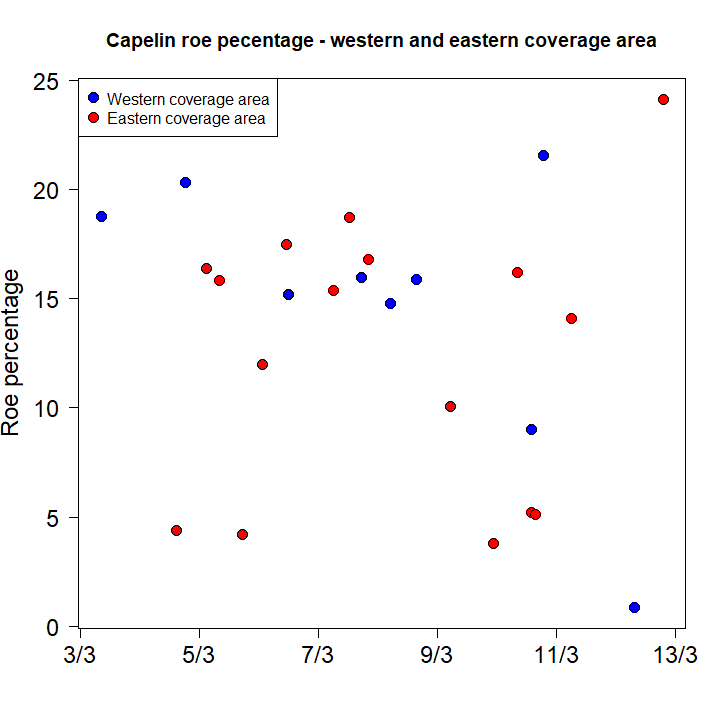
Fig. 9. Capelin roe percentage (Weight of roe in all sampled females divided by the total weight of those females) per station as a function of time. Blue : Stations from Eros in the western coverage area, and red : stations from Vendla in the eastern coverage area.