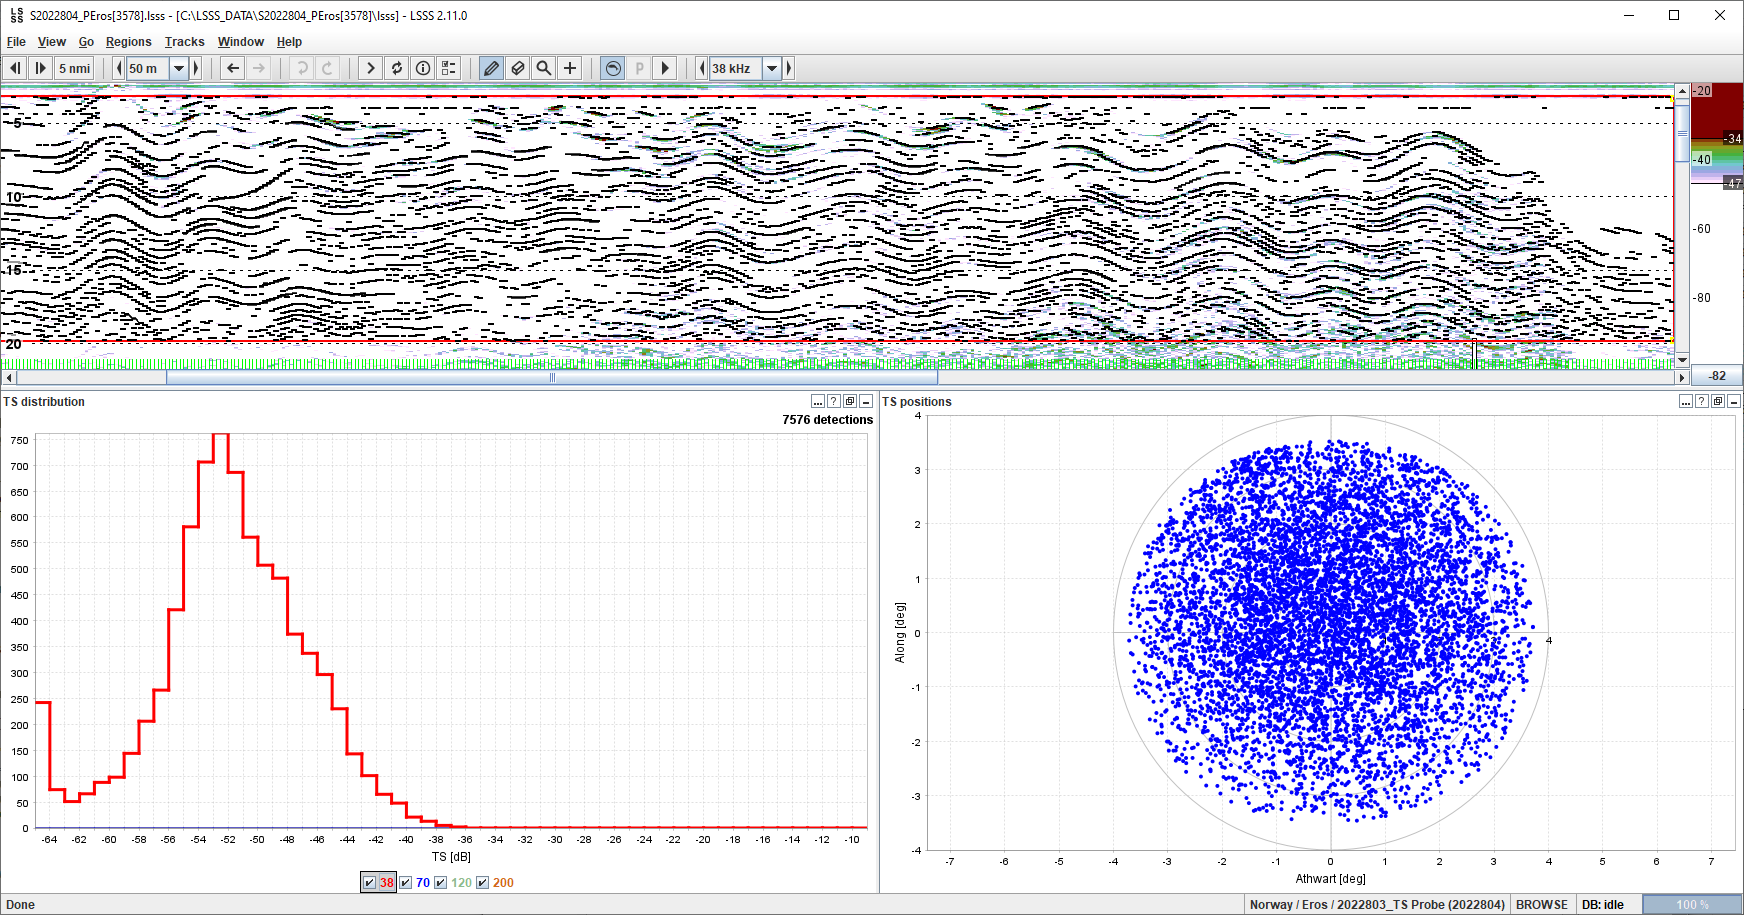
Fig. 12 . Echograms showing TS probe measurements at 38 kHz in CW transmission mode from Vendla (upper panel) and Eros (lower panel). Single individual fish were detected below a denser layer in the data from Vendla , and from a very disperse layer in Eros data. The histogram shows the target strength of the single targets and the polar plot their position inside the beam.