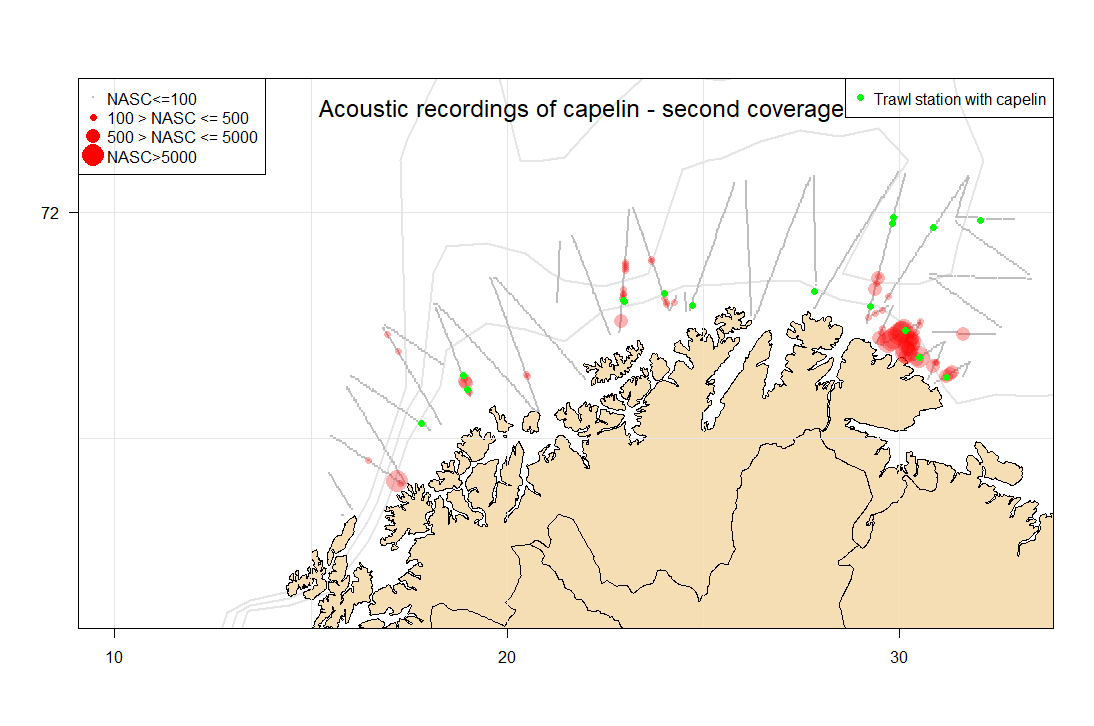
Fig. 5. Distribution of NASC (m2nmi-2) allocated to capelin from the first coverage going in the eastward direction (upper panel) and the second coverage going in the westward direction (lower panel). The size of the circles corresponds to NASC-value per 1 nautical mile.