Gå til hovedinnhold
Havforskningsinstituttet
HI
English
<- Tilbake
Søk
Søk
Søk
View page in English
Figur
Fra rapporten:
Testing of trawl-acoustic stock estimation of spawning capelin 2022
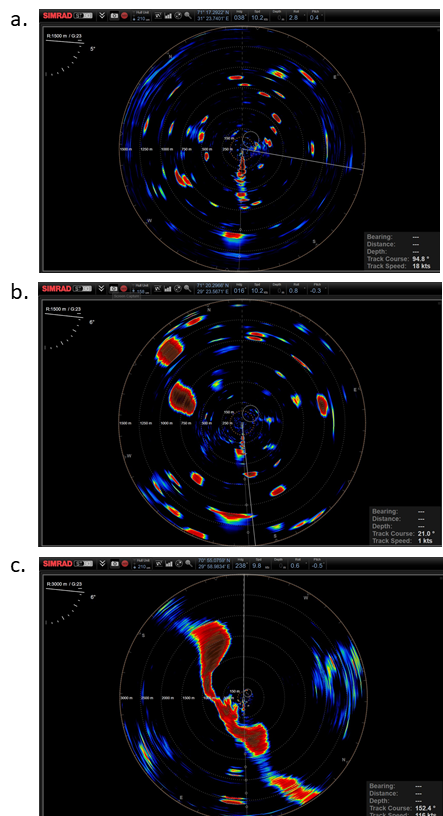
Fig. 7. Examples of capelin distributions observed with the sonar. Small to medium sized schools (a), medium to large sized schools (b) and large layers (c). The sonar range in panel a and b is 1500 m and in panel c 3000 m.