Gå til hovedinnhold
Havforskningsinstituttet
HI
English
<- Tilbake
Søk
Søk
Søk
View page in English
Figur
Fra rapporten:
Survey report: Developing methods for abundance estimation of bluefin tuna in Norwegian waters
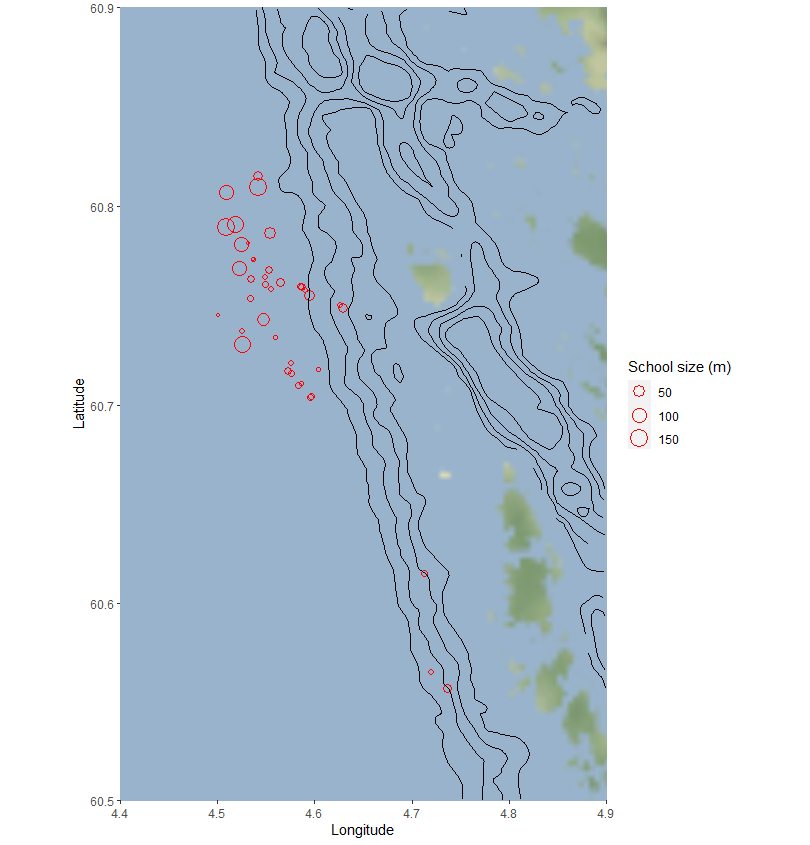
Figure 12. Location of bluefin tuna schools measured with medium frequency sonar CS90 during 6th October. Symbol size proportional to the diameter the school measured along the sonar beams. Bathymetric curves are also shown in black.