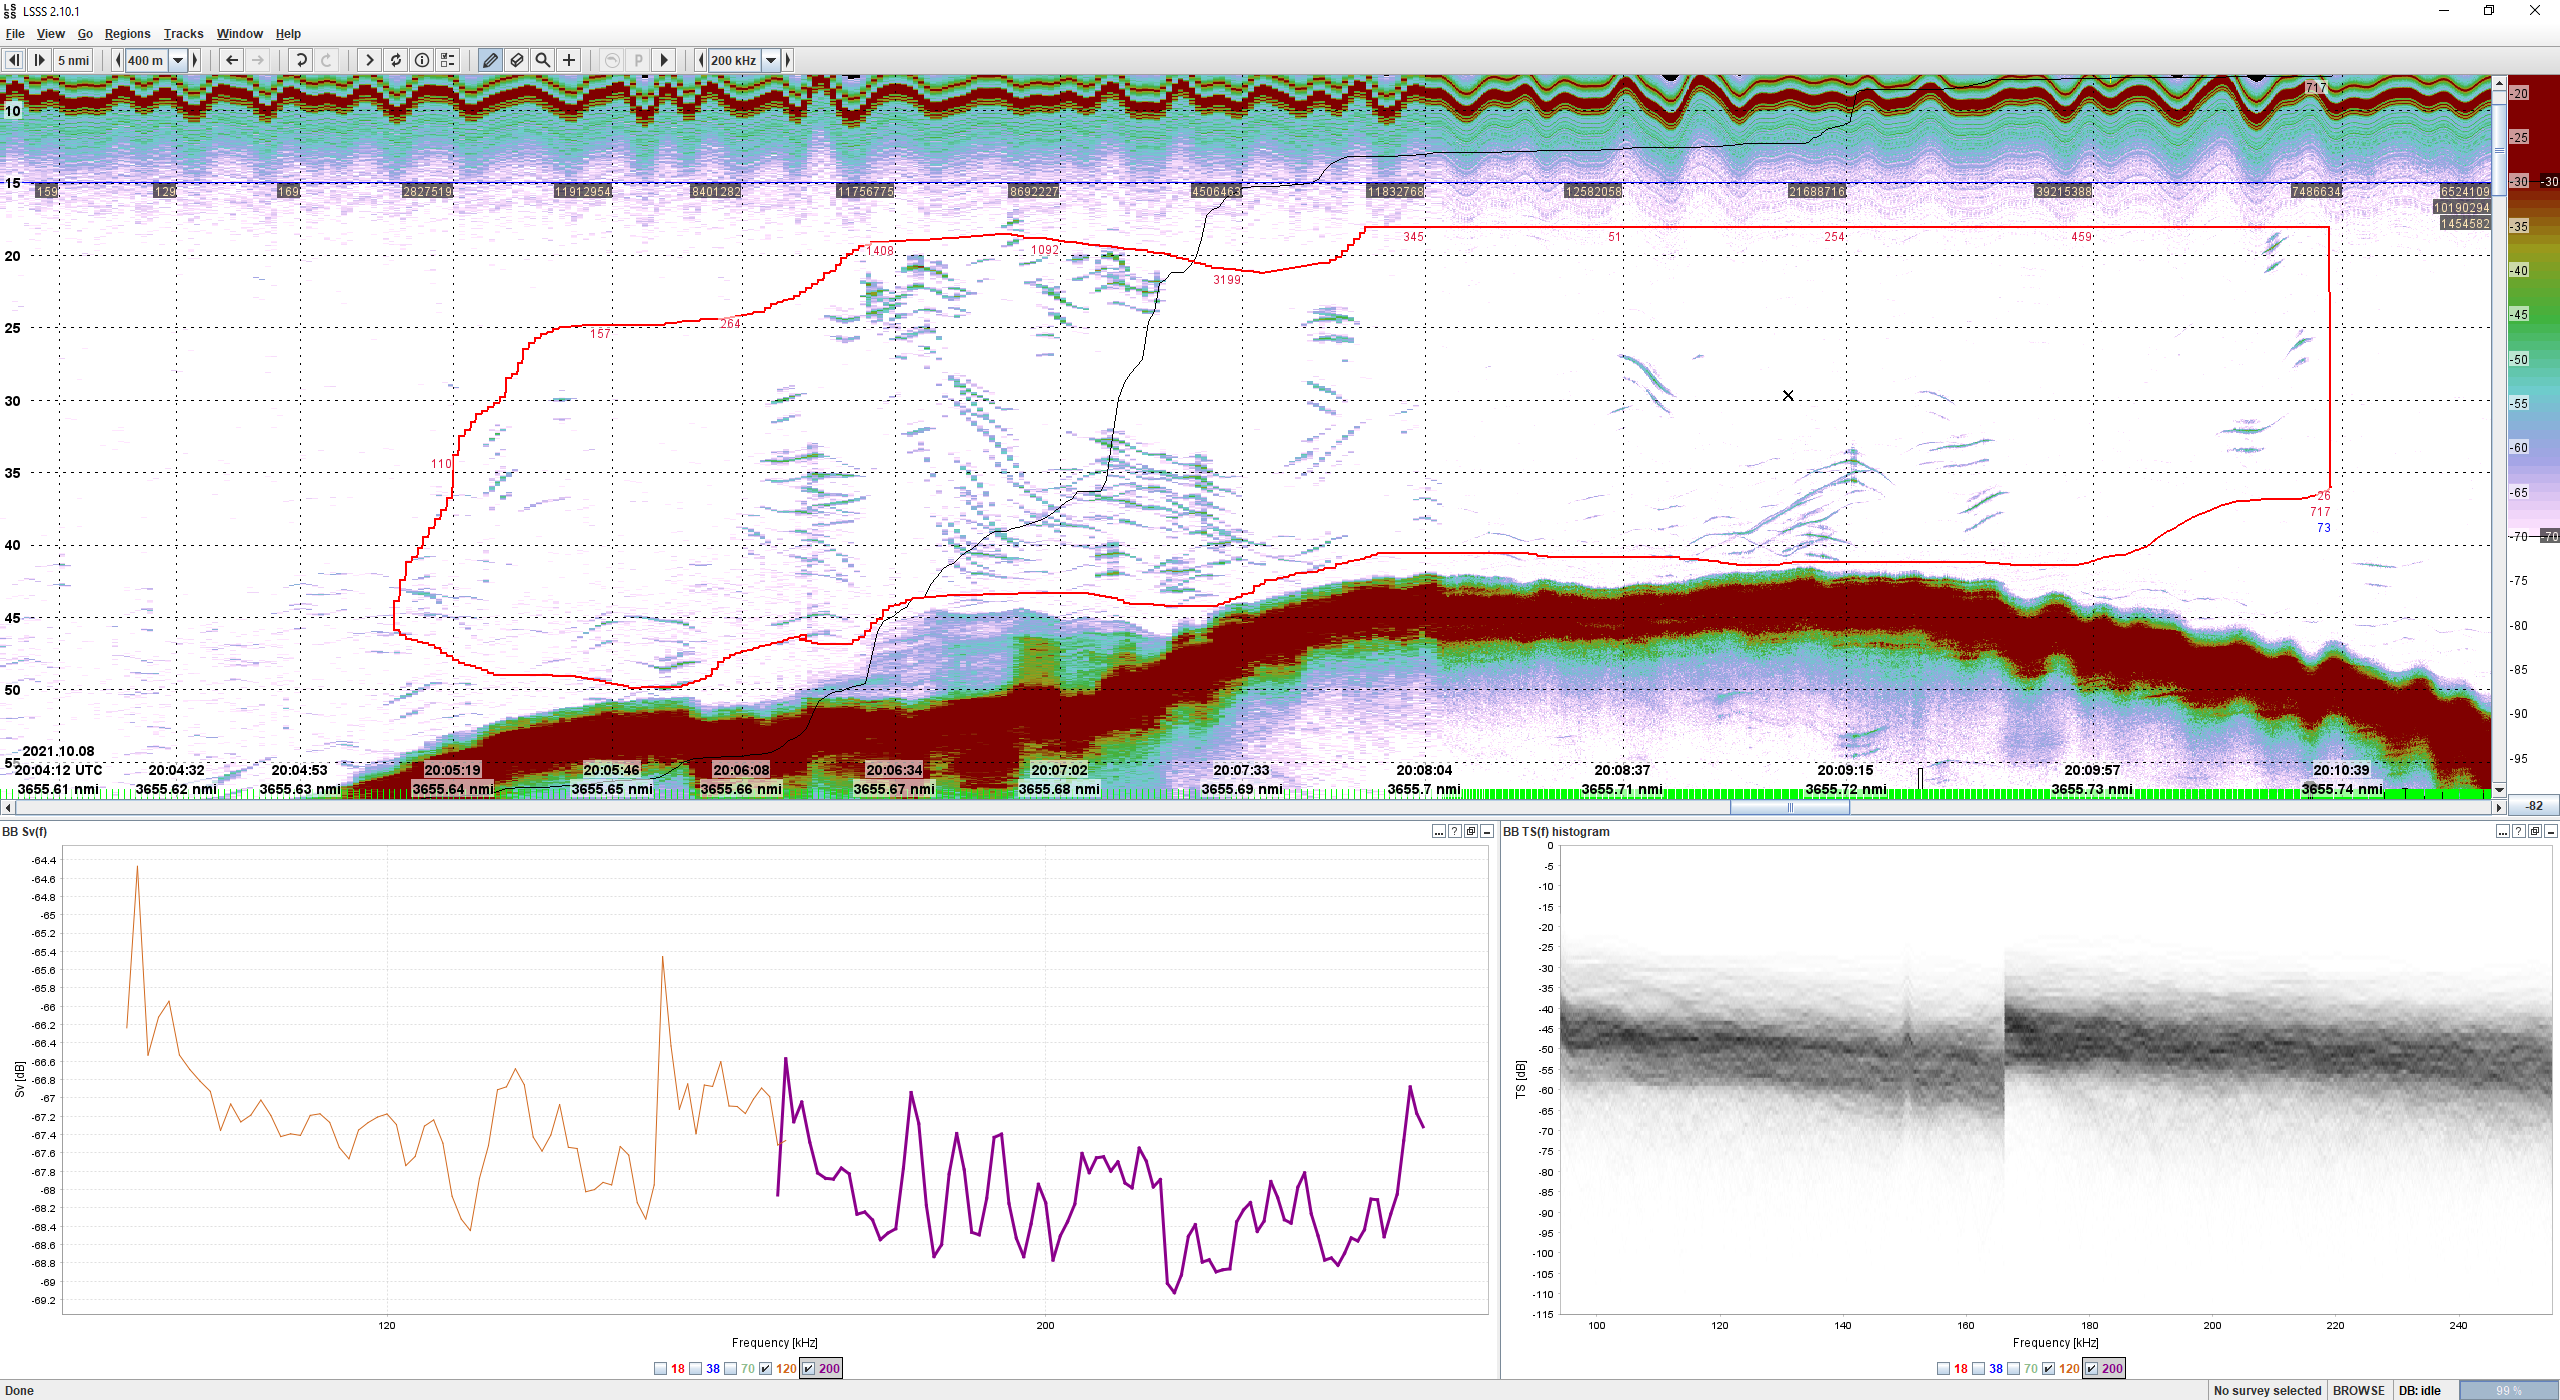
Figure 10. EK80 echo sounder recordings of bluefin tuna (top panel) and possible prey fish (bottom panel). In each figure an echogram of 200 kHz is displayed in the upper panel, the volume backscattering strength (Sv) for the broadband frequencies of 120 and 200 kHz (bottom left panel) and histogram of target strength detections in the same frequency range (bottom right panel).