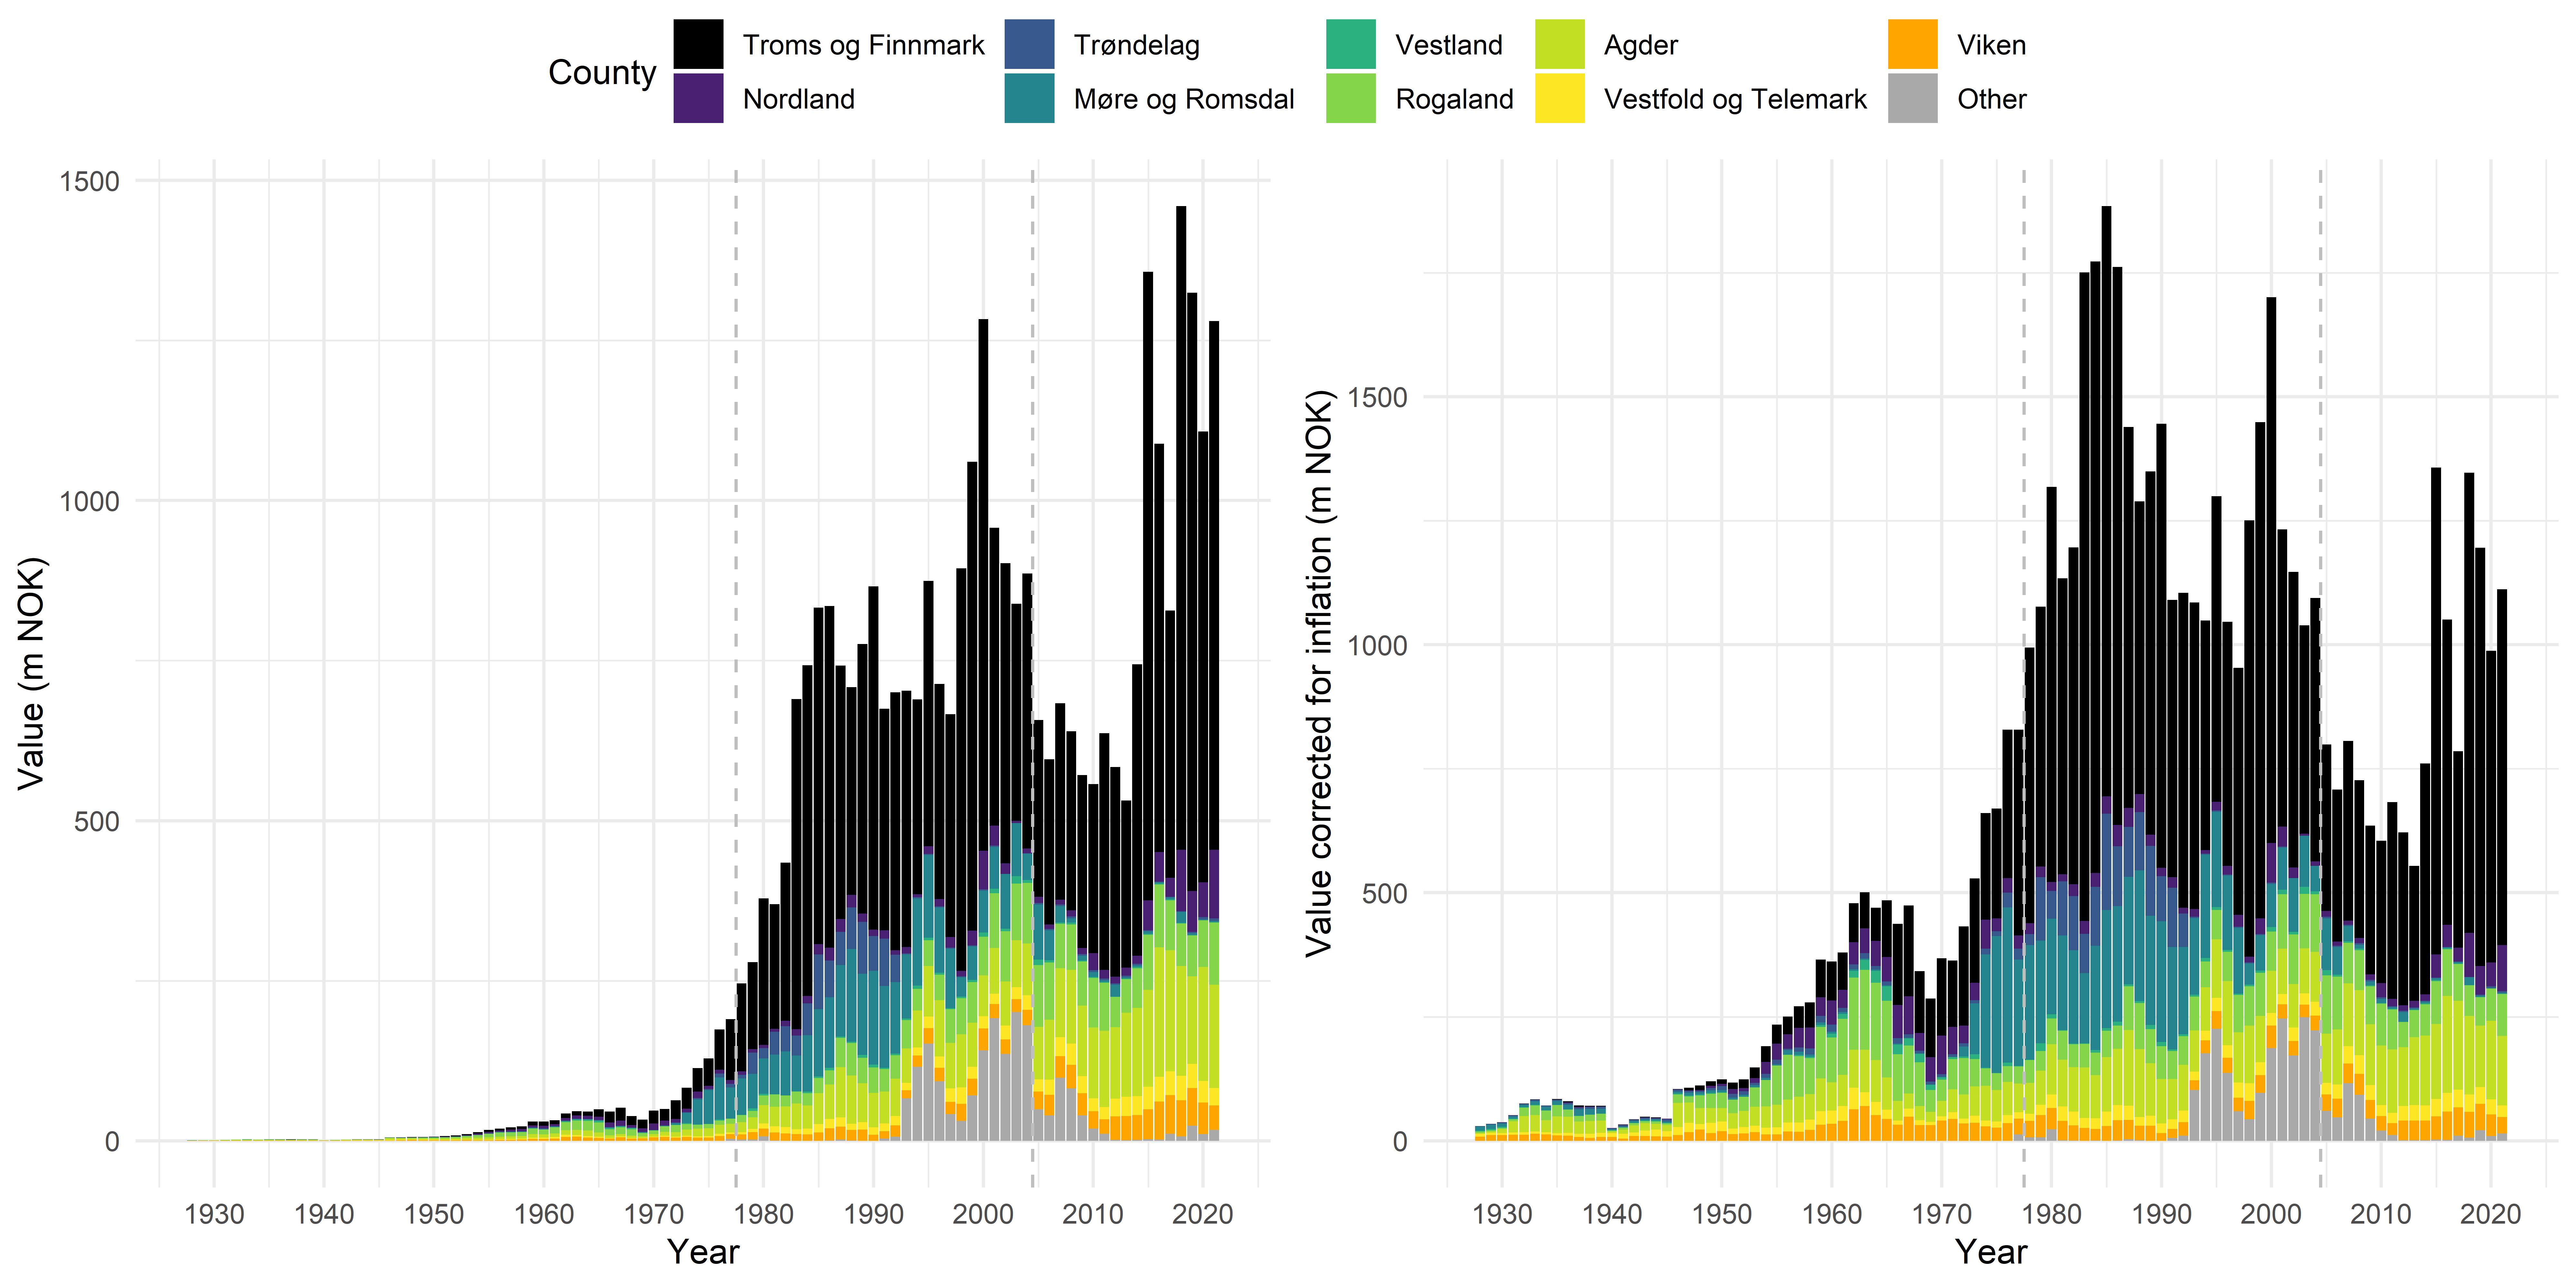
Figure 11. Total value of landings (million NOK) over time per county (county borders since January 1, 2020), nominal (left) and corrected for consumer price inflation (adjusted to 2014, right). “Other” includes landings abroad or at unknown locations. Value of landings in Oslo were too negligible to be visible and are therefore included in Viken values. Vertical dashed lines indicate the different time series: historic landings data (1908-1976, SSB), aggregated (1977-2004) and detailed sales slips (2005-2021, Norwegian Directorate of Fisheries).