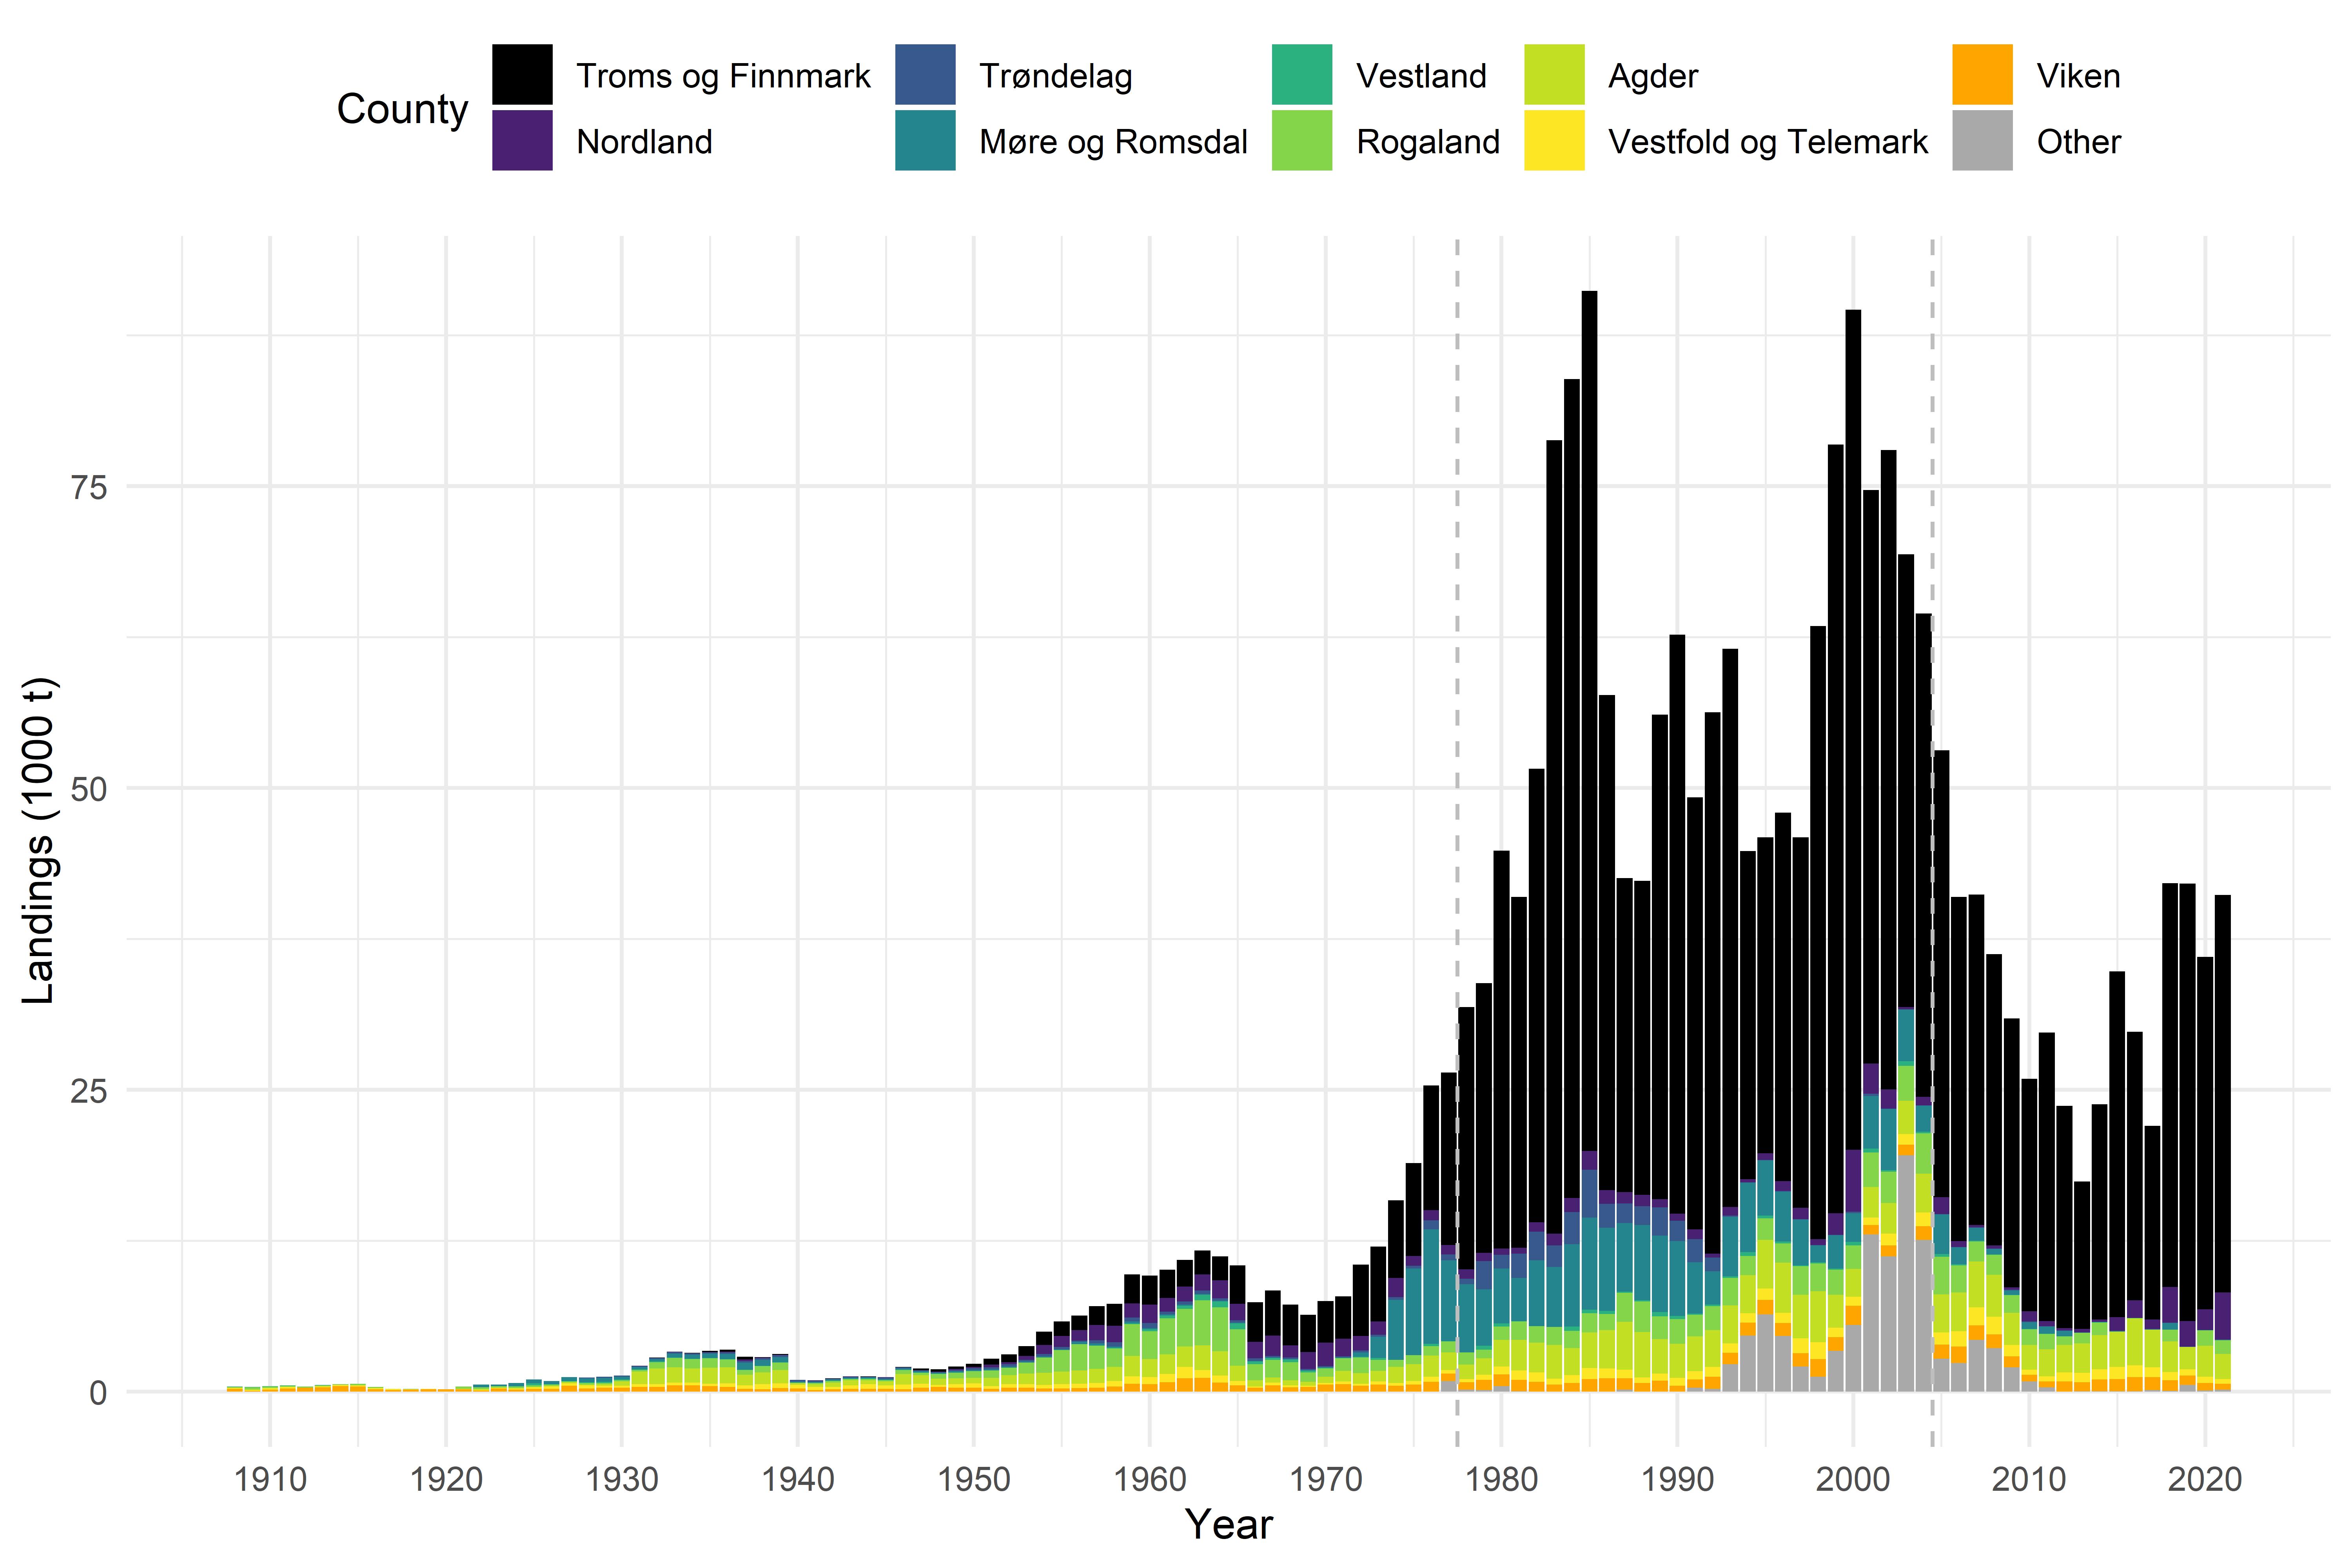
Figure 4. Total Norwegian landings (1000 t) per year and county (county borders since January 1, 2020), including landings from foreign vessels into Norwegian ports. The data include landings from both Norwegian waters as well as waters of other countries and international waters. “Other” includes landings landed abroad or at unknown locations. Annual amounts landed in Oslo were too negligible to be visible and are therefore included in Viken landings. Vertical dashed lines indicate the different time
series: historic landings data (1908-1976, SSB), aggregated (1977-2004) and detailed sales slips (2005-2021, Norwegian Directorate of Fisheries).