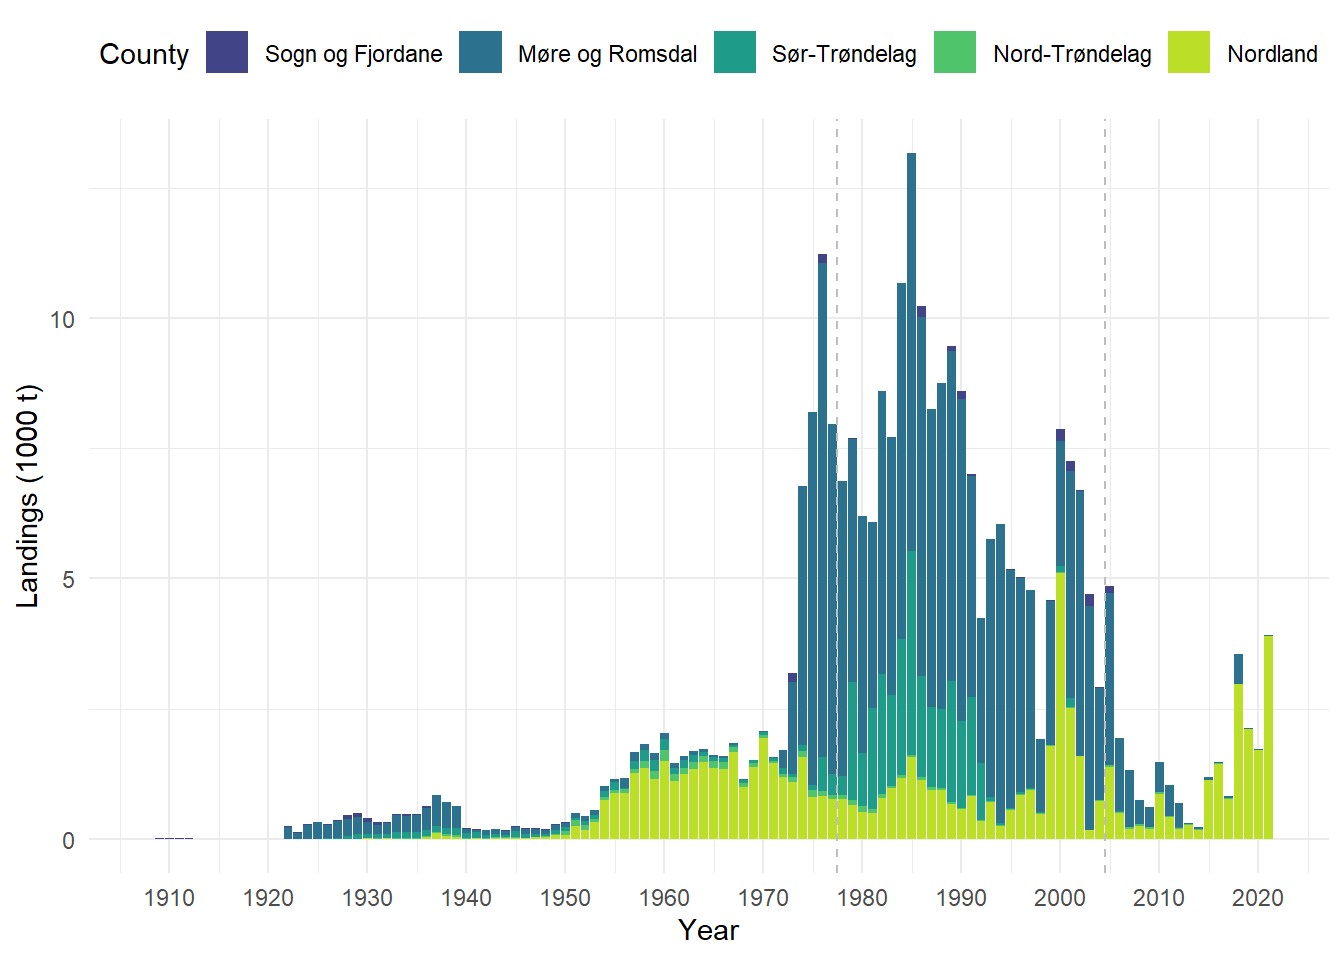
Figure 9. Total Norwegian landings (1000 t) per year and county in Mid-Norway (county borders until December 31, 2019), including landings from foreign vessels into Norwegian ports. The data include landings from both Norwegian waters as well as waters of other countries and international waters. Vertical dashed lines indicate the different time series: historic landings data (1908-1976, SSB), aggregated (1977-2004) and detailed sales slips (2005-2021, Norwegian Directorate of Fisheries). Note that landings in Sogn og Fjordane are shown in Figure 7 as well, included in landings from the new county of Vestland.