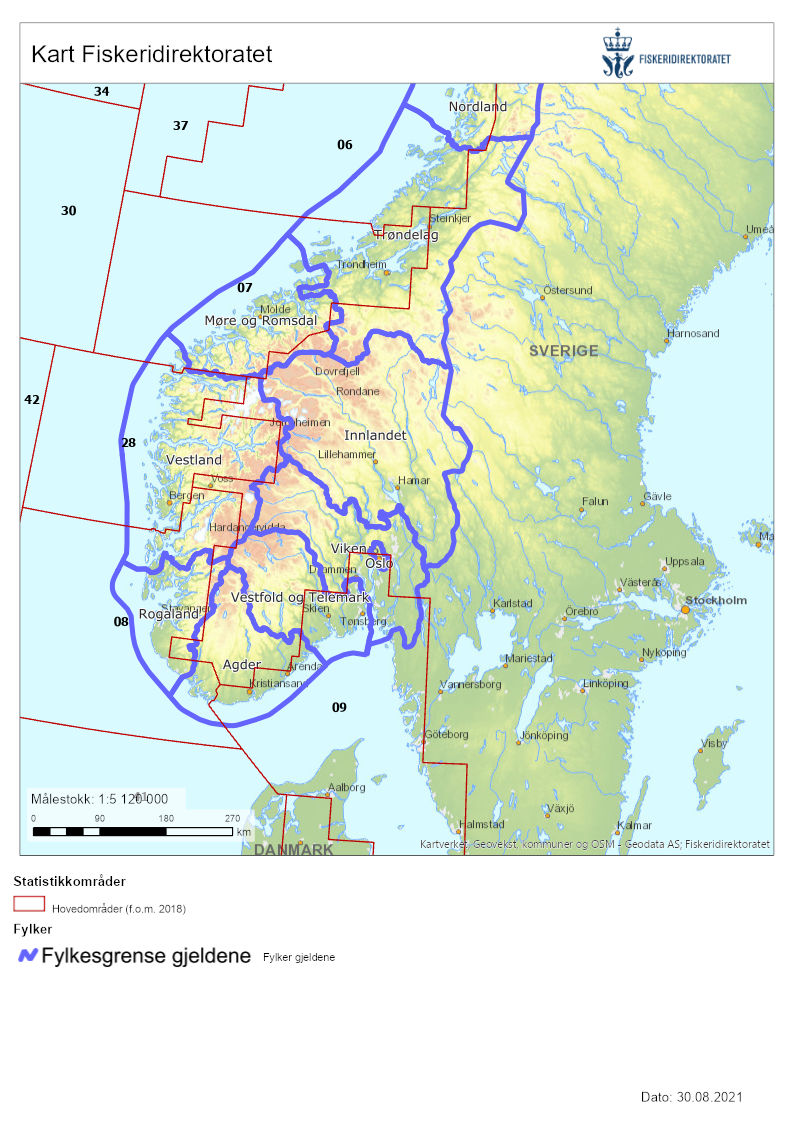
Figure 8. Counties (county borders since January 1, 2020) (thick, blue line) and statistical areas from the Norwegian Directorate of Fisheries (thin, red line). Map from the Norwegian Directorate of Fisheries (Maps from the Directorate of Fisheries).