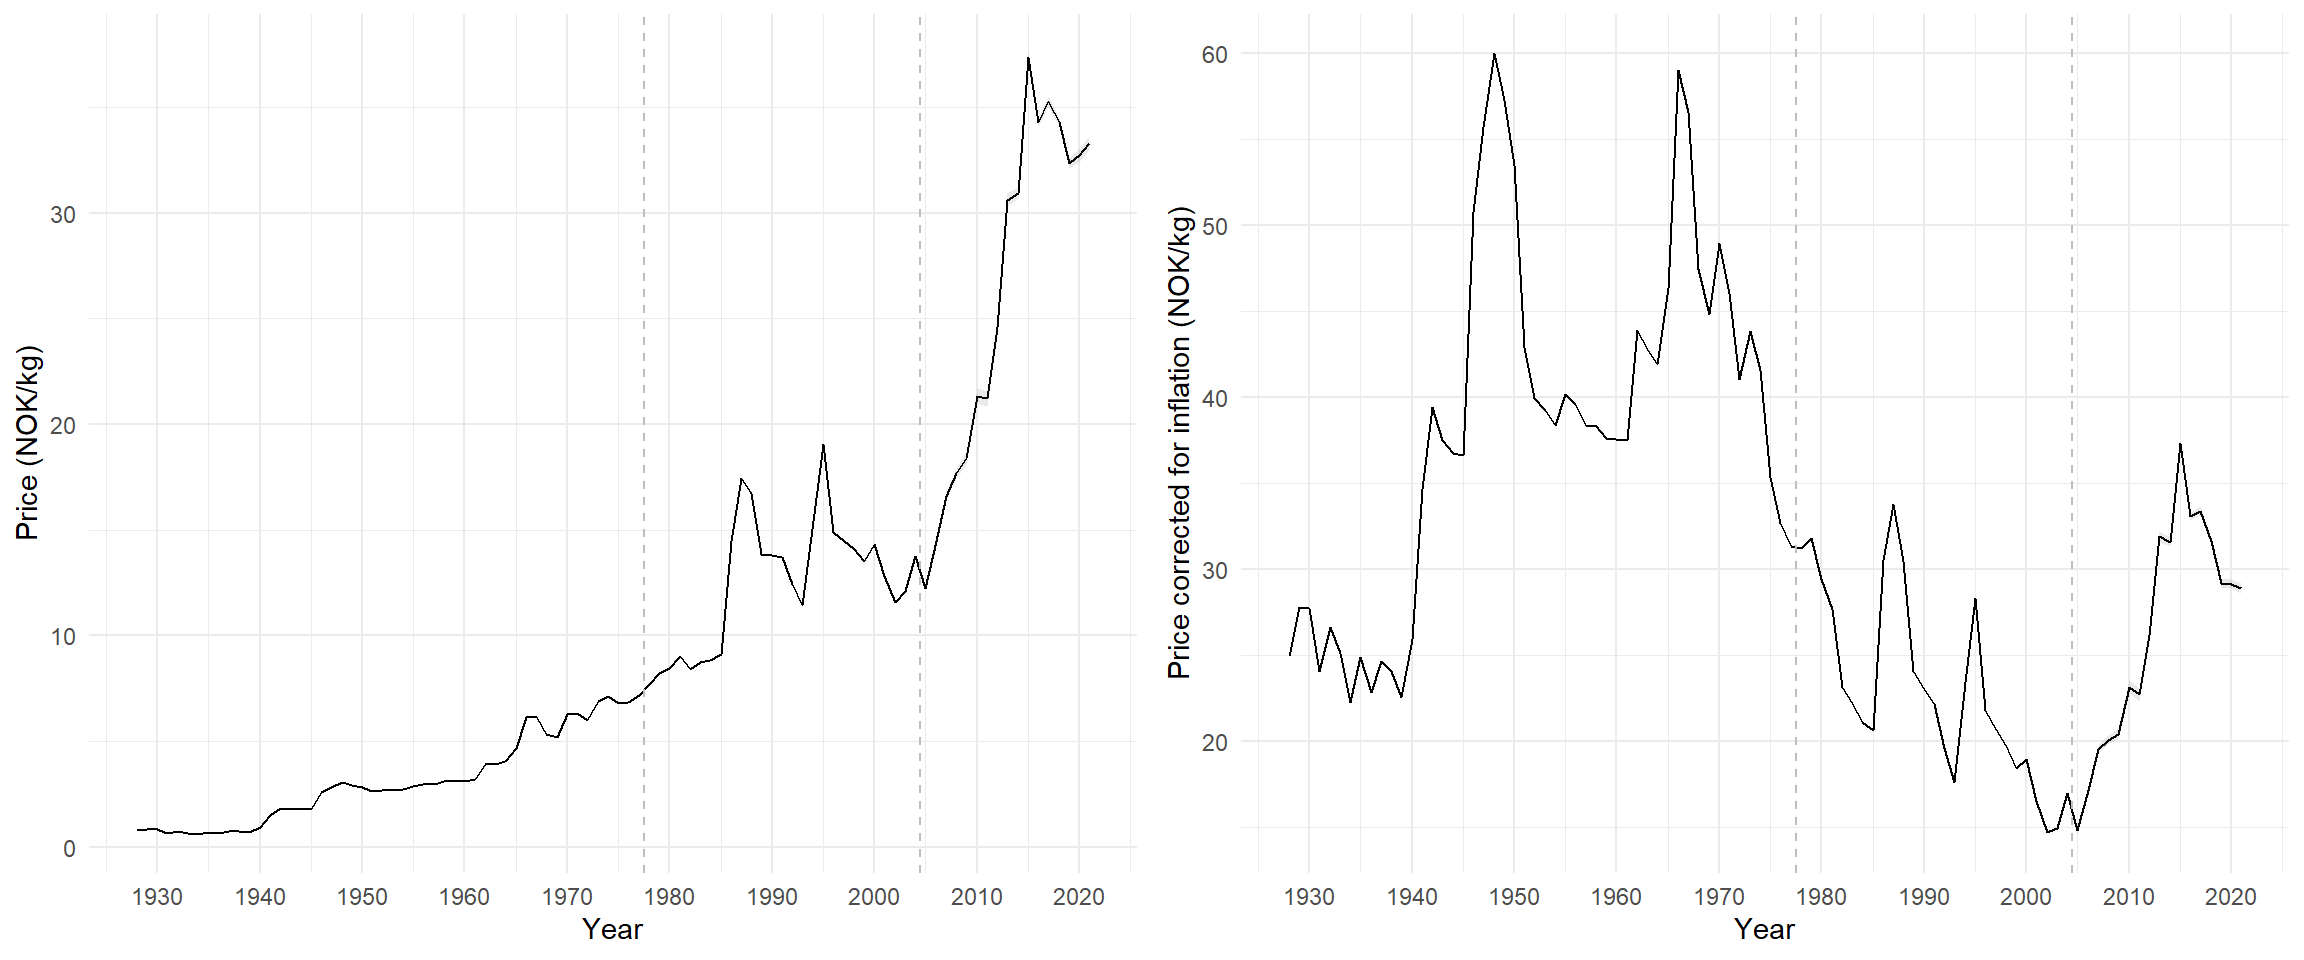
Figure 12. Landing price over time, nominal average prices (left) and average prices corrected for consumer price inflation (adjusted to 2014, right). The price in 1928-2004 is the ratio of total value over landings, while from 2005 onwards mean price per landing was used. Vertical dashed lines indicate the different time series: historic landings data (1908-1976, SSB), aggregated (1977-2004) and detailed sales slips (2005-2021, Norwegian Directorate of Fisheries).