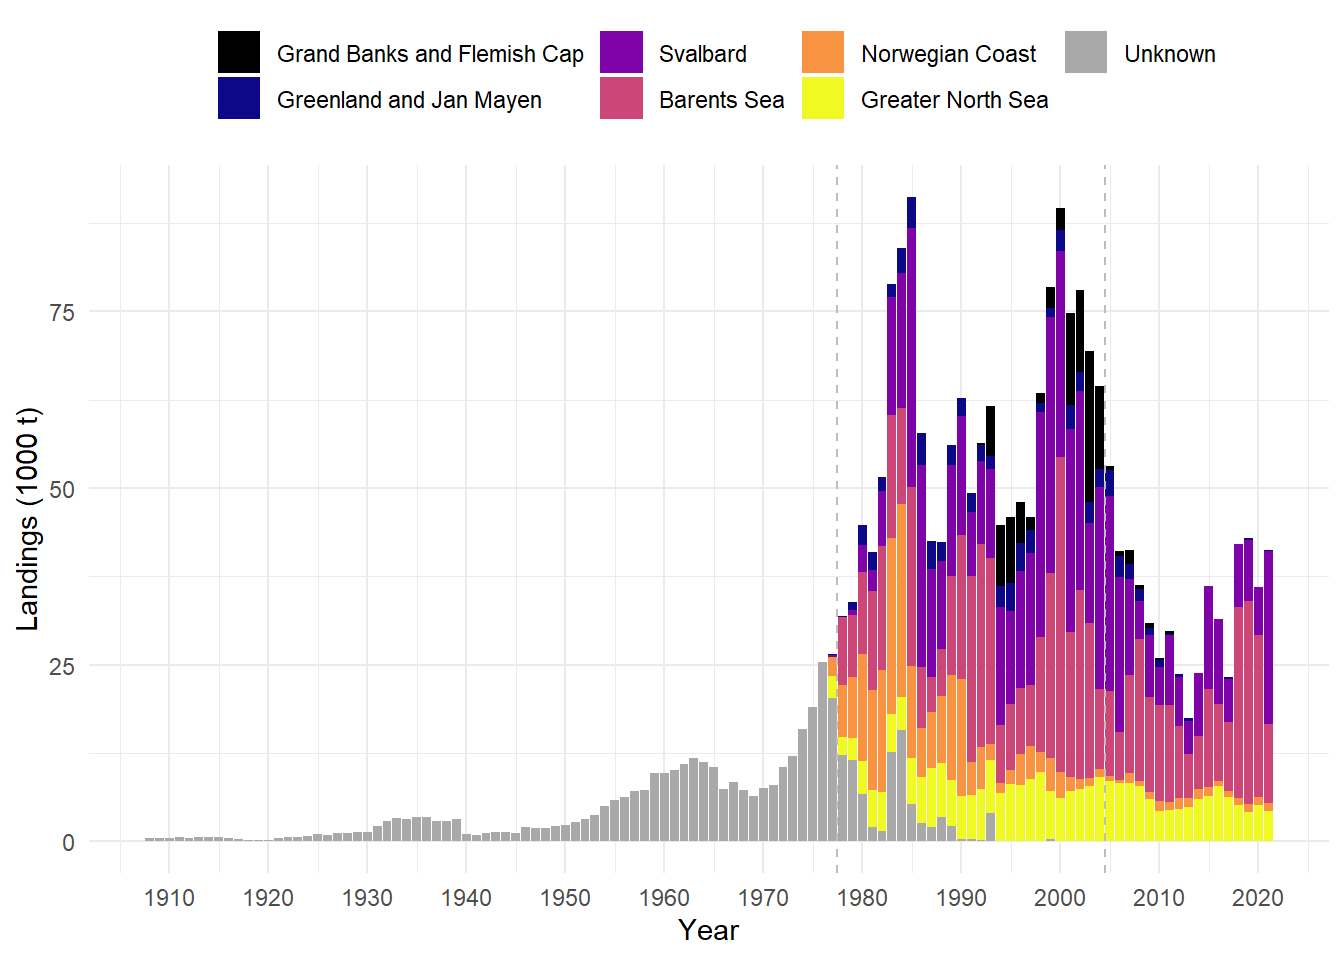
Figure 6. Total Norwegian landings (1000 t) per year and fishing region (Table 1), including landings from foreign vessels into Norwegian ports. “Unknown” includes landings without a fishing area listed (applies for all landings before 1977 and parts of 1977-2004). Vertical dashed lines indicate the different time series: historic landings data (1908-1976, SSB), aggregated (1977-2004) and detailed sales slips (2005-2021, Norwegian Directorate of Fisheries).