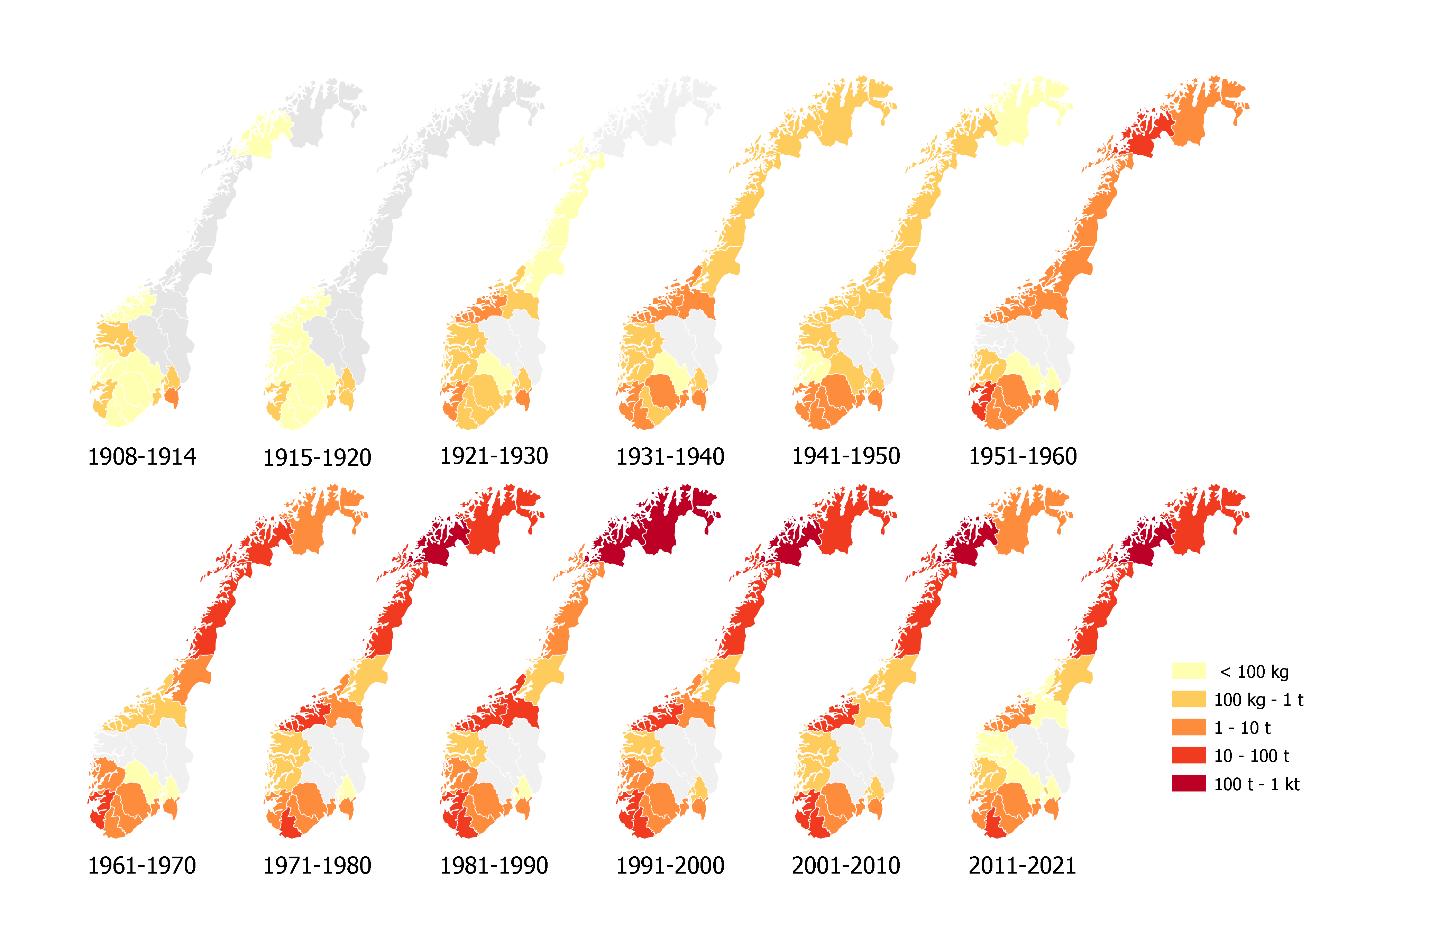
Figure 5. Landings of northern shrimp (t) by county (county borders until December 31, 2019) for 10-year periods, 1908-2021. The first two maps show shorter time periods. The colour scale shows weight of landings, from <100 kg (light yellow) to the highest landings (100 t-1 kt) (dark red).