Gå til hovedinnhold
Havforskningsinstituttet
HI
English
<- Tilbake
Søk
Søk
Søk
View page in English
Figur
Fra rapporten:
Report of the Joint Russian-Norwegian Working Group on Arctic Fisheries (JRN-AFWG) 2022
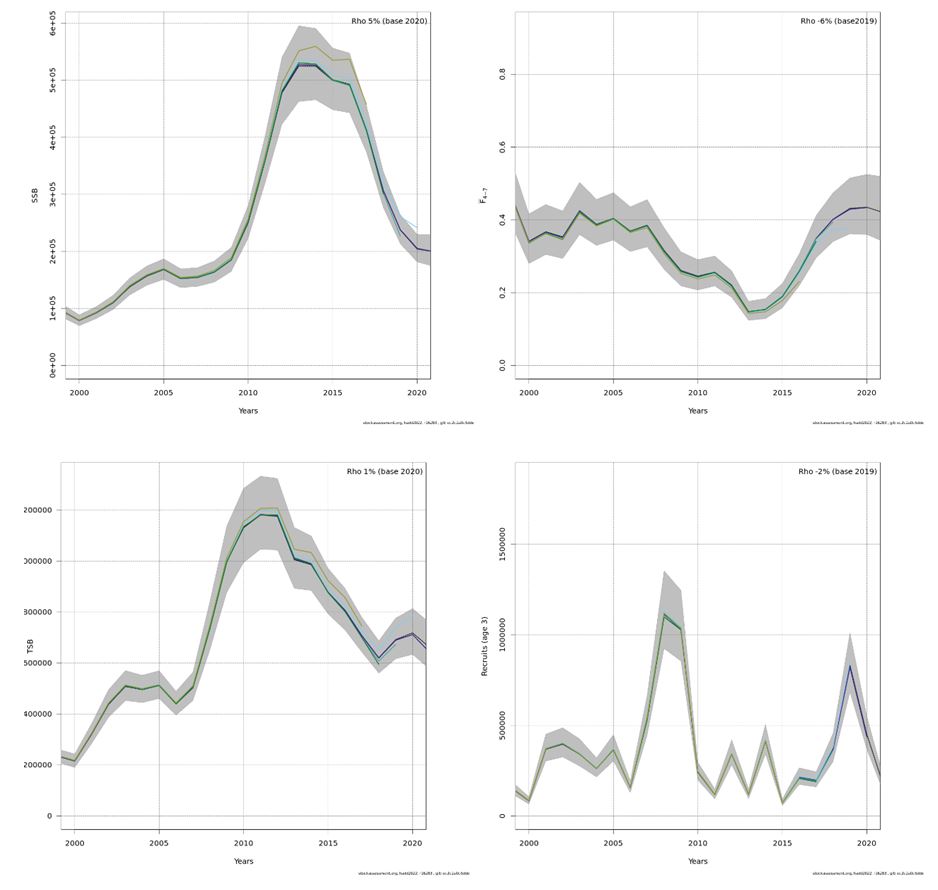
Figure 4.3. Northeast Arctic haddock. 5 year retrospective plots of SSB (top right), fishing mortality (top left), TSB (bottom left), and recruitment (bottom right) for years 2000–2022 (SAM with 95% confidence intervals).