Gå til hovedinnhold
Havforskningsinstituttet
HI
English
<- Tilbake
Søk
Søk
Søk
View page in English
Figur
Fra rapporten:
Report of the Joint Russian-Norwegian Working Group on Arctic Fisheries (JRN-AFWG) 2022
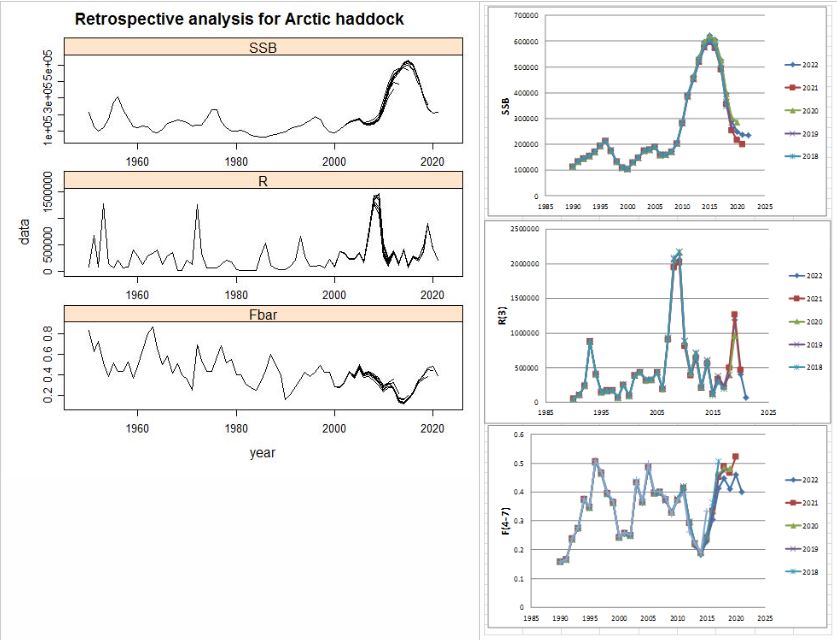
Figure 4.5. Northeast Arctic haddock. Retrospective plots of SSB, fishing mortality and recruitment for assessment years 1950–2021 ( left - XSA without P shrinkage, F shrinkage= 0.5 ) and right - for assessment years 1990–2021 from the TSVPA model.