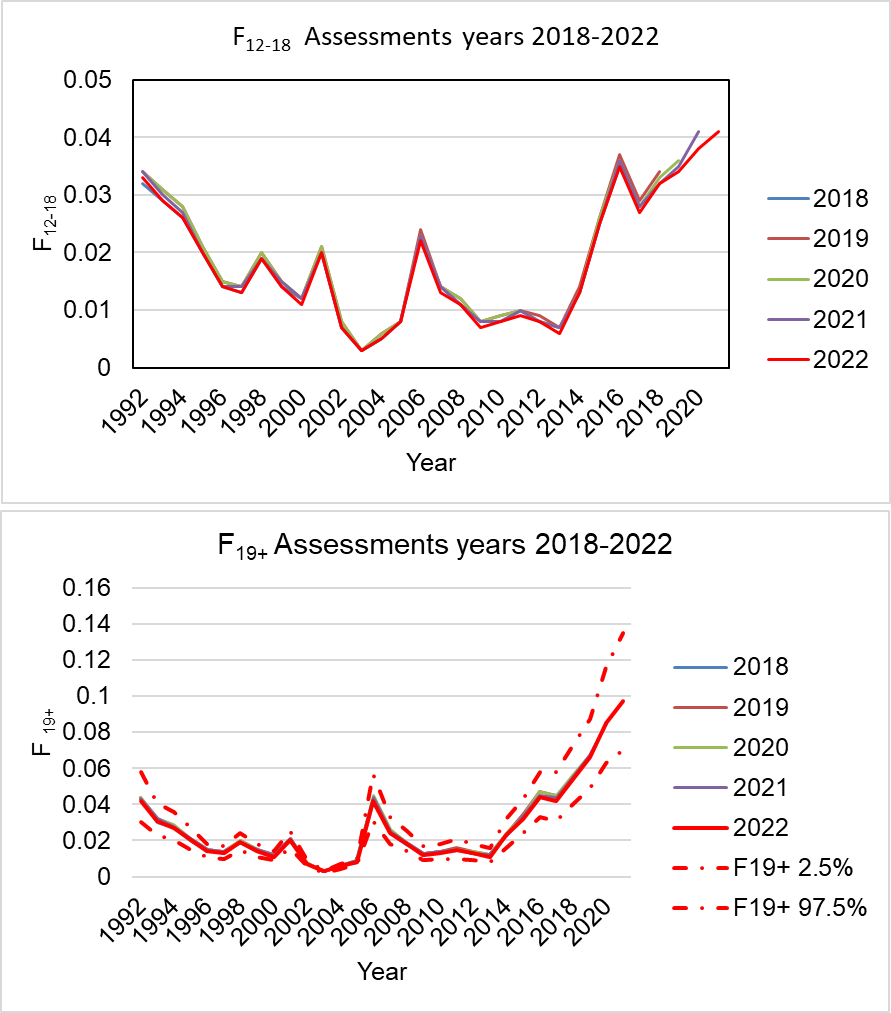
Figure 6.25. The upper panel shows the retrospective patterns of the fishing mortality for the age classes 12-18, estimated by the SCAA model for runs up to years 2018-2022. The lower panel presents fishing mortality for the age-19+ group for the same time period. Broken lines indicate the confidence intervals for the 2022 assessments.