Gå til hovedinnhold
Havforskningsinstituttet
HI
English
<- Tilbake
Søk
Søk
Søk
View page in English
Figur
Fra rapporten:
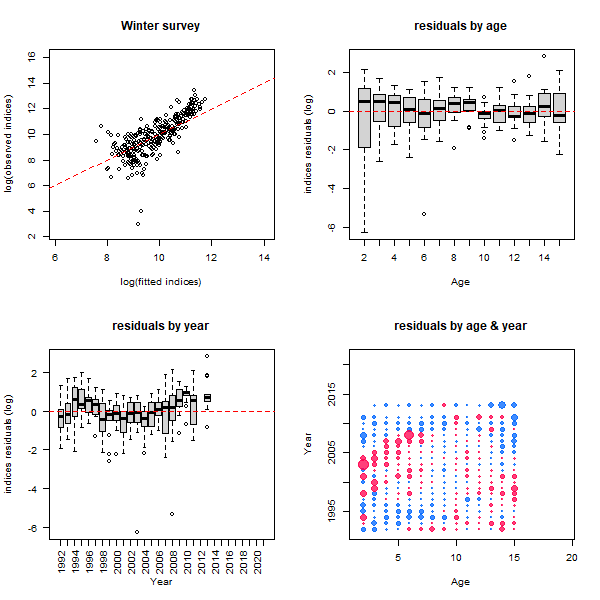
Report of the Joint Russian-Norwegian Working Group on Arctic Fisheries (JRN-AFWG) 2022
Figure 6.23c. Diagnostic plots for winter survey data. See legend from Figure 6.23a.