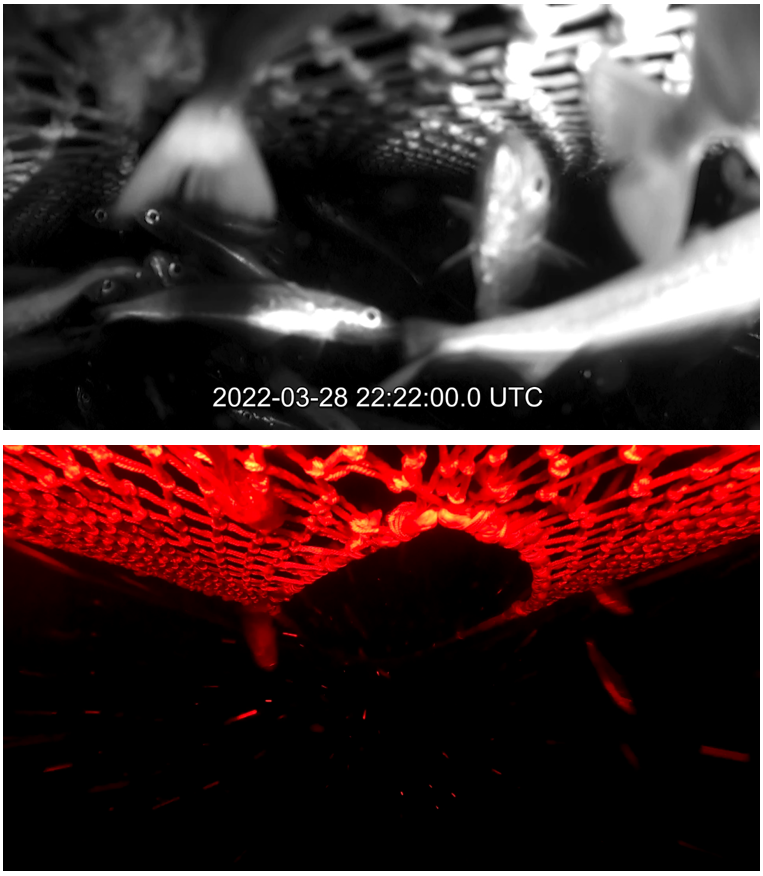
Figure 6.2 – Images from video taken at 22:22 during haul B05, just before the start of haul-back at 22:24. Top: from position 5B look aft toward the fish-lock and cod-end, showing high densities of fish in the top of the FRS. Bottom: from position 4F, looking forward below the escape opening, with three fish escaping. Note – the escape rate at this time was approximately 42 fish/minute [22:22-22:23] and 39 fish/minute [22:24-22:25].