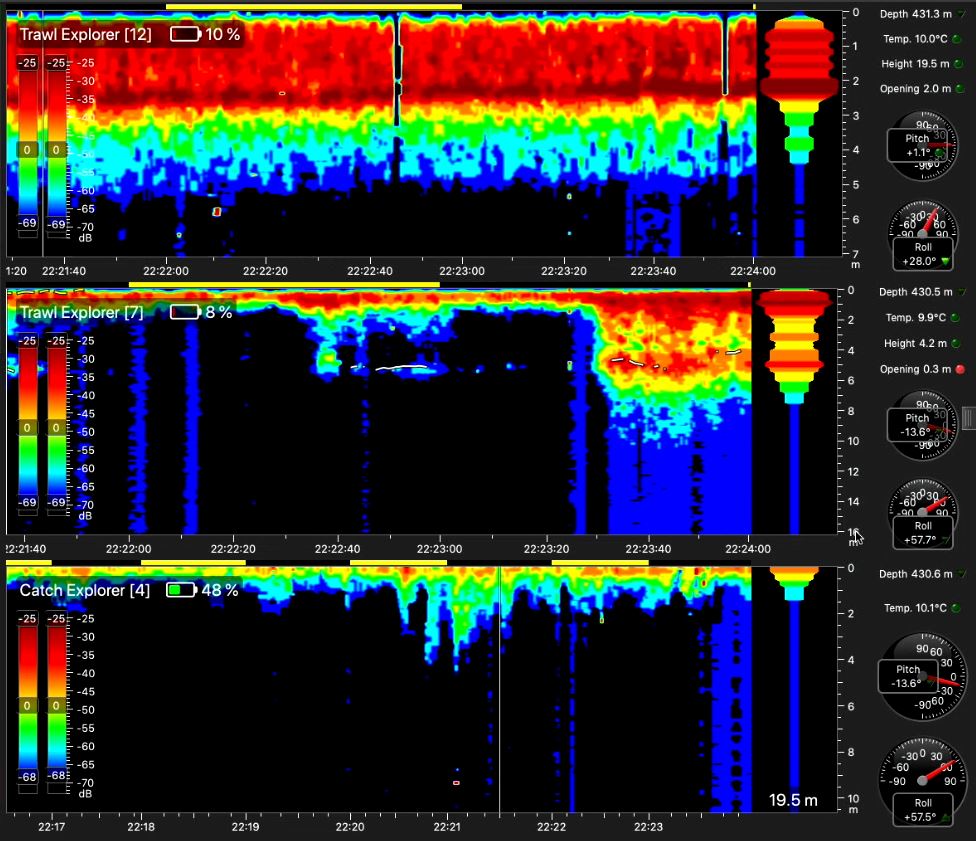
Figure 6.1 – Cod-end echo-sounder (CE_ES) echogram output from haul B05, just before haul-back began. Top: from forward of the FRS at CE-ES #1; Centre: from above the FRS at CE-ES #2; and Bottom: from behind the FRS at CS #4. CE-ES #1 shows high density accumulations of fish ahead of the FRS, while both CE-ES #2 CS #4 have periods where the densities are so high that the signal becomes occluded. These signals were confirmed by video camera (see figure 6.2).