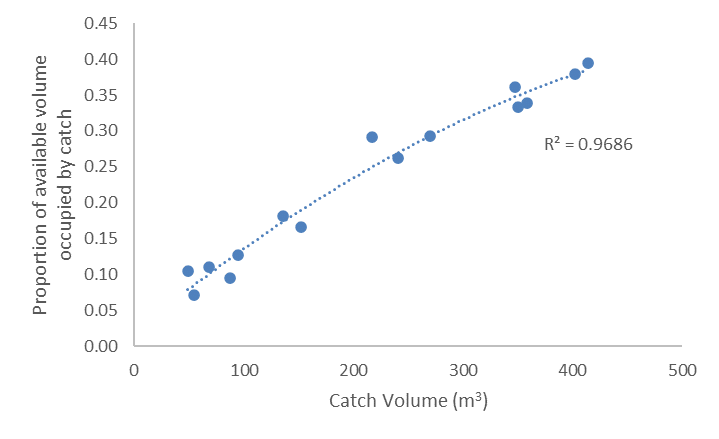
Figure 5.6 - The relationship between predetermined, empirical catch volume (m3) and the proportion of the theoretically available cod-end volume occupied by that catch increases significantly and consistently (R 2 0.9686) with increasing catch size. This suggests catch density in the cod-end also increases with increasing catch size.