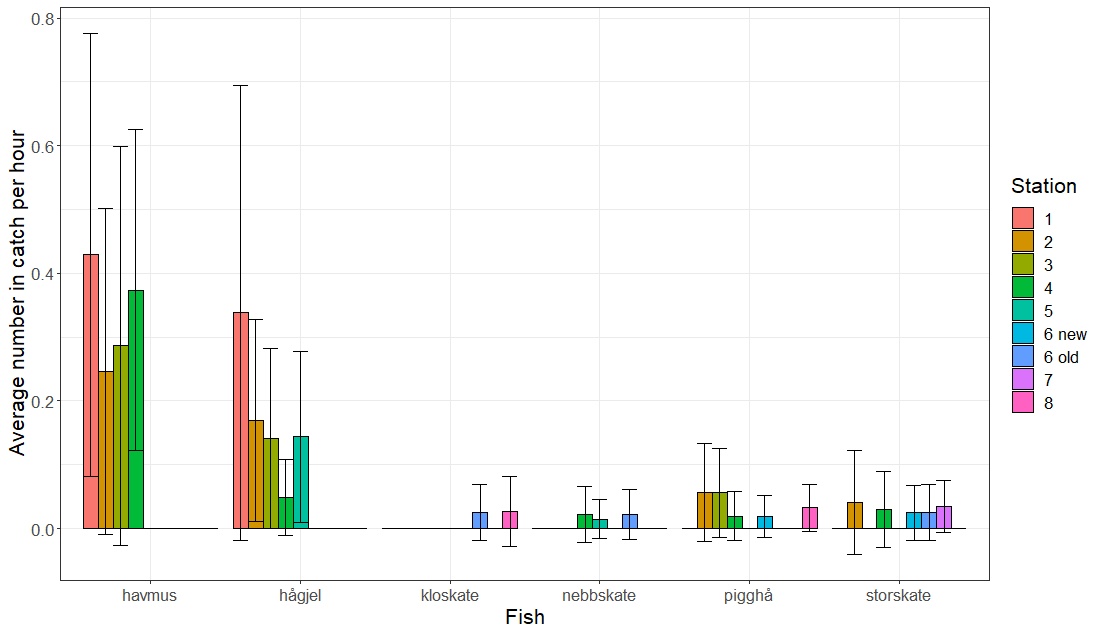
Figure 10: Average number of fish caught in gillnets at different distances from the planned location of the windfarm site for all other species. Location 1 was closest to the windfarm site, location 8 was furthest away (Figure 1). Before averaging, the number of fish per catch was divided by soak time to calculate catch per hour. Standard deviations of the means are shown by error bars. See Table 3 for English species names