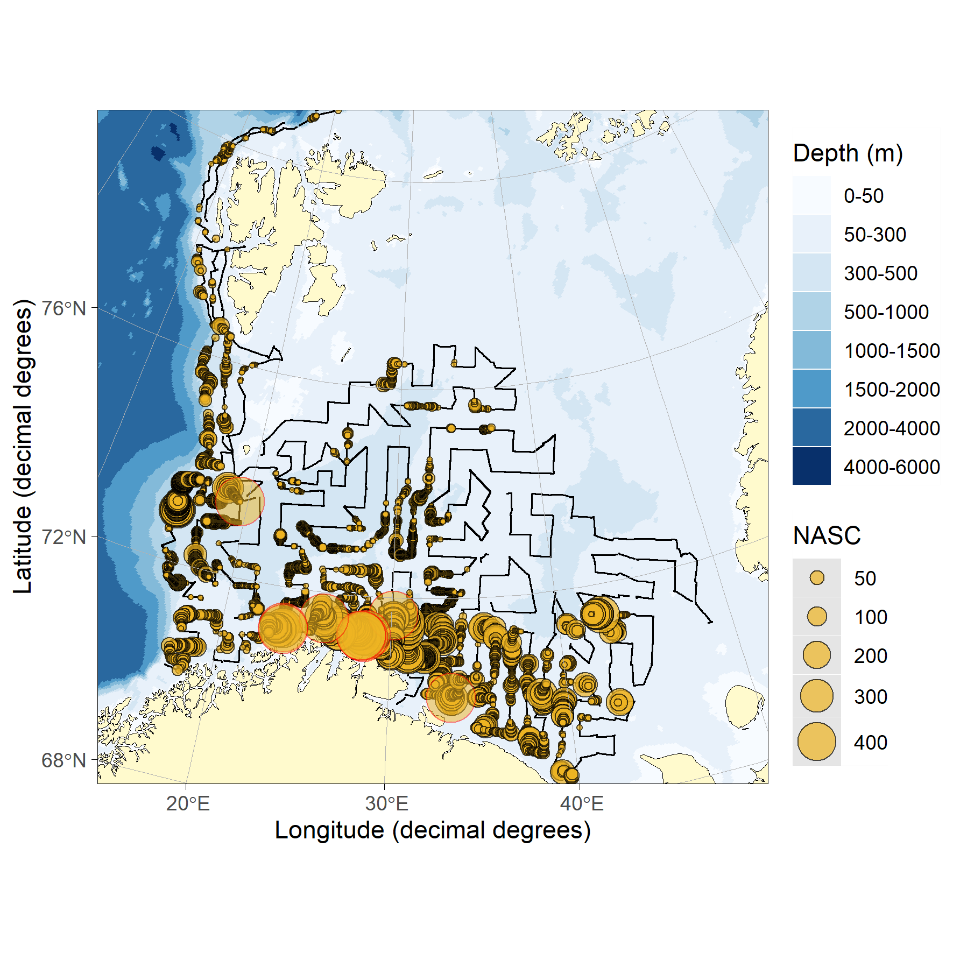
Figure 6.1. HADDOCK NASC. Distribution of acoustic backscatter (m2/nmi2 ) assigned to haddock in 2022. The black lines without yellow circles represent parts of the cruise track where the acoustic backscatter was scrutinized but not assigned to haddock. NASC values < 5 was set to zero for this illustration. Circles with red outline represent NASC > 500.