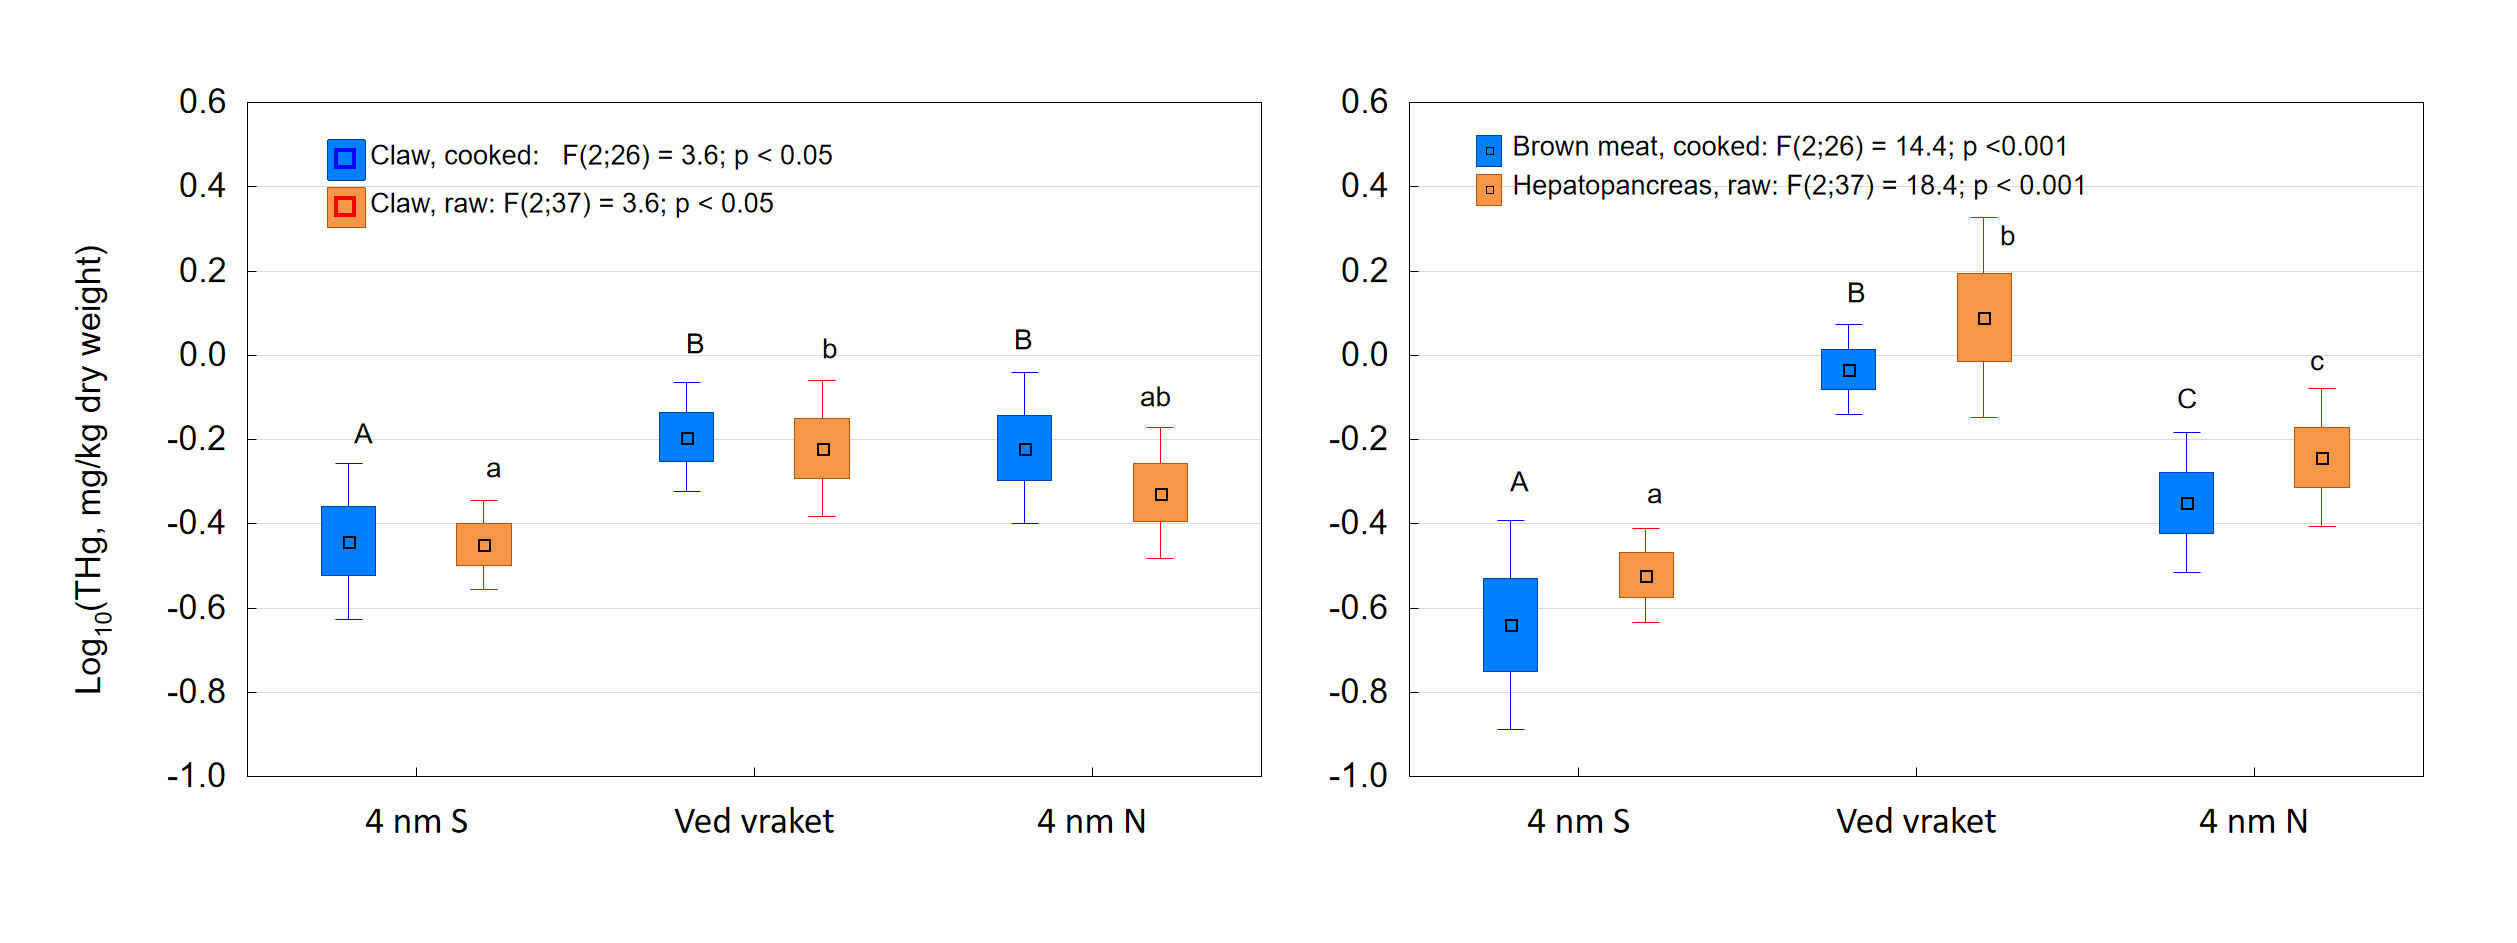
Figur 4. Comparison of dry weight total mercury concentrations (THg, mg/kg dry weight) in crab (Cancer pagurus) tissue between different localities; at the wreck of U-864 (“ved vraket”), four nautical miles north of the wreck (4 nm N) and four nautical miles south of the wreck (4 nm S). Results are given for claw meat of raw and cooked crabs and for hepatopancreas of raw crabs and brown meat of cooked crabs. Boxplots show means, standard errors and 95% confidence intervals of log 10 transformed concentrations. Results of one-way ANOVA are shown for each tissue/treatment type, and different letters above the boxes indicate significant differences between groups.